It is a matter of common observation that the wind is not steady and in order to calculate the mean power delivered by a wind turbine from its power curve, it is necessary to know the probability density distribution of the wind speed. This is simply the distribution of the proportion of time spent by the wind within narrow bands of wind speed.
In order to calculate the mean power from a wind turbine over a range of mean wind speeds, a generalised expression is needed for the probability density distribution. An expression which gives a good fit to wind data is known as the Weibull distribution. In non-dimensional form, this can be written as:
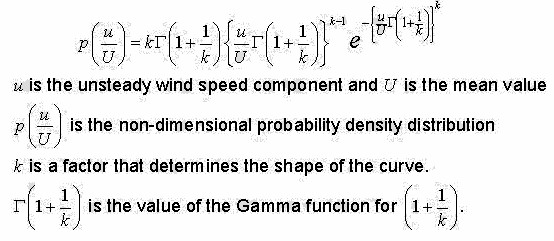
In order to fit wind speed data to this equation, we need a value for the shape factor k. This is often obtained by some form of fitting procedure to the measured probability distribution but this is unnecessarily complicated. One of the simplest measures of the unsteady component of a random variable is the standard deviation or root mean square of the variable (σ) and, for the Weibull distribution, this can be shown to be given by
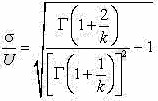
A particular form of the Weibull distribution is referred to as the Rayleigh distribution and occurs when k=2. This is equivalent to a standard deviation of 52% of the mean wind speed and is taken as the default value in the Wind Power program. However, in the program, this ratio can easily be scrolled from 20% to 100% and the effect of this on mean power instantly displayed.
It should be said that the present procedure for obtaining the Weibull shape factor, k, is a lot simpler and more direct than the rather complex non-linear fitting procedures often used and, moreover, it enables k to be obtained directly from the standard deviation – which is an easy quantity to measure.
A wind rose is a graphic tool used by meteorologists to give a succinct view of how wind speed and direction are typically distributed at a particular location. Historically, wind roses were predecessors of the compass rose (found on maps), as there was no differentiation between a cardinal direction and the wind which blew from such a direction. Using a polar coordinate system of gridding, the frequency of winds over a long time period is plotted by wind direction, with color bands showing wind ranges. The directions of the rose with the longest spoke show the wind direction with the greatest frequency.
The density of air, ρ (Greek: rho) (air density), is the mass per unit volume of Earth’s atmosphere. Air density, like air pressure, decreases with increasing altitude. It also changes with variation in temperature or humidity. At sea level and at 15 °C, air has a density of approximately 1.225 kg/m3 (0.001225 g/cm3, 0.0023769 slug/ft3, 0.0765 lbm/ft3) according to ISA (International Standard Atmosphere).
Depending on the measuring instruments, use, area of expertise and necessary rigor of the result different calculation criteria and sets of equations for the calculation of the density of air are used. This topic are some examples of calculations with the main variables involved, the amounts presented throughout these examples are properly referenced usual values, different values can be found in other references depending on the criteria used for the calculation . Furthermore we must pay attention to the fact that air is a mixture of gases and the calculation always simplify, to a greater or lesser extent, the properties of the mixture and the values for the composition according to the criteria of calculation.
The density of dry air can be calculated using the ideal gas law, expressed as a function of temperature and pressure:
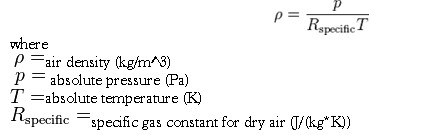
The specific gas constant for dry air is 287.058 J/(kg•K) in SI units, and 53.35 (ft•lbf)/(lbm•°R) in United States customary and Imperial units. This quantity may vary slightly depending on the molecular composition of air at a particular location.
Therefore:
- At IUPAC standard temperature and pressure (0 °C and 100 kPa), dry air has a density of 1.2754 kg/m3.
- At 20 °C and 101.325 kPa, dry air has a density of 1.2041 kg/m3.
- At 70 °F and 14.696 psi, dry air has a density of 0.074887lbm/ft
In common usage, wind gradient, more specifically wind speed gradient or wind velocity gradient, or alternatively shear wind, is the vertical gradient of the mean horizontal wind speed in the lower atmosphere. It is the rate of increase of wind strength with unit increase in height above ground level. In metric units, it is often measured in units of meters per second of speed, per kilometer of height (m/s/km), which reduces to the standard unit of shear rate, inverse seconds (s−1).
Surface friction forces the surface wind to slow and turn near the surface of the Earth, blowing directly towards the low pressure, when compared to the winds in the nearly frictionless flow well above the Earth’s surface. This layer, where surface friction slows the wind and changes the wind direction, is known as the planetary boundary layer. Daytime solar heating due to insolation thickens the boundary layer as winds at the surface become increasingly mixed with winds aloft. Radiative cooling overnight decouples the winds at the surface from the winds above the boundary layer, increasing vertical wind shear near the surface, also known as wind gradient.
A wind farm or wind park is a group of wind turbines in the same location used to produce electricity. A large wind farm may consist of several hundred individual wind turbines and cover an extended area of hundreds of square miles, but the land between the turbines may be used for agricultural or other purposes. A wind farm can also be located offshore.
