Various project management and planning tools are used which are
Flowchart
It is used to develop a process map. A process map is a graphical representation of a process which displays the sequence of tasks using flowcharting symbols.
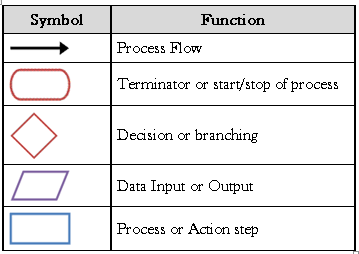
It shows the inputs, actions and outputs of a given system. Inputs are the factors of production like land, materials, labor, equipment, and management. Actions are the way in which the inputs are processed and value is added to the product like procedures, handling, storage, transportation, and processing. Outputs are the finished good or delivered service given to the customer but, output also includes un-planned and undesirable entities like scrap, rework, pollution, etc. Flowchart symbols are standardized by ANSI and common symbols used are
The flowchart shows a high-level view of a process view and it’s capability analysis. The flow chart can be made either more complex or less complex.
In the practice of DMAIC – Define, Measure, Analyze, Improve, and Control – you will often find that a flowchart is helpful in the Define, Measure, and the Analyze steps in the process. Flowcharts and process mapping are used to depict the flow of activity in a process.
Process maps and flowcharts are often used interchangeably, although they are not exactly the same thing. A flowchart is the diagram itself, while process mapping involves the flowchart being used to map a process in order to identify the waste, and the non-value-added activities in a process.
Gantt Chart
It is a graphical chart, showing the relationships amongst the project tasks, along with time constraints. The horizontal axis of a Gantt chart shows the units of time (days, weeks, months, etc.). The vertical axis shows the activities to be completed. Bars show the estimated start time and duration of the various activities. A Gantt chart shows what has to be done (the activities) and when (the schedule) as shown in the figure below
A Gantt chart consists of multiple rows and columns. Typically it includes columns for task ID number, task name, duration, and date. The rows list major tasks and sub-tasks, each of which is assigned its own ID number. Next, each task has a duration specified – which is how long the task should take to complete. In the date column, the start and end dates of the task are indicated. These are equivalent to the duration specified in the duration column for the task.
The Gantt chart is a very common tool used throughout a project for various purposes. It’s used for tracking progress and for controlling performance. The basic layout of a Gantt chart includes numbered rows. Each row is allocated to a major task or a sub task. Each task has a duration that’s specified, for example in hours, days, weeks, or months. The chart also has a date column – so at a specific date, you can check the progress of a task or the project itself.
As an example, a Gantt chart might include four columns – ID, Task name, Duration and Date – and multiple rows, each identifying a particular task. The Duration column specifies the duration of each task in number of days and the Date column contains a block for each task, shaded to show progress in completing the task. For example, a block that’s half-shaded indicates that the corresponding task is 50% completed. Lines link the tasks to show their relationships and dependencies, and a vertical status line is used to indicate the current date. This makes it easy to spot tasks that are behind where they should be.
WBS
A work breakdown structure (WBS) is a tool used to detail how a project is broken down into smaller jobs. Its structure can be likened to that of an inverted tree diagram. The trick is to break the work down into the smallest increments so you can get down to assignable tasks.
The top level of the WBS is the project that you’re chartering. The next level of the structure is the major deliverables that you need to accomplish for a project to be successful. This level may also identify major phases in a project or its external sub-projects.
In turn, each major deliverable has tasks that should be completed to achieve the major deliverable. The tasks can also be further broken down into sub-tasks. Then from each sub-task, you can generate work packages, which are very specific tactical things that need to be done to accomplish the project’s objective. These are at the bottom.
A WBS breaks a project into manageable units which are “bite-size chunks” of work that can readily be delegated and that can be used to define responsibilities, timing, and so on. It also facilitates scheduling by identifying relationships and dependencies between the tasks. Done correctly, we can do backward scheduling, working from a given due date out in the future and backward to when we’d need to start the project. In the case of forward scheduling, if we started today, what’s the soonest we can have this project completed?
Also, it’s often not possible to really get to the true budget for a project until you’ve fully broken down what needs to be done. Using a WBS, you can uncover all of the tasks, dependencies, and specific resources that need to be engaged at the task level, deep down in the project.
A WBS may include columns for recording the name or number of each task and sub-task, a description, the person responsible for the task, the time in hours that the task is expected to take to complete, and the date when the work is due, or the point in the project time line when the specified task needs to be completed.
Major tasks might be identified by number while sub-tasks are identified using letters, for example.
CPM/PERT Chart
A program evaluation review technique (PERT) chart incorporates some important data. For each step in the process, you’re able to create relationships with succeeding steps. They can be start-to-start or finish-to-finish. You can create lags and other kinds of relationships between different activities. You can roll all these out and begin to calculate what’s called three critical paths. This allows you to do additional project risk analysis and understand slack time analysis.
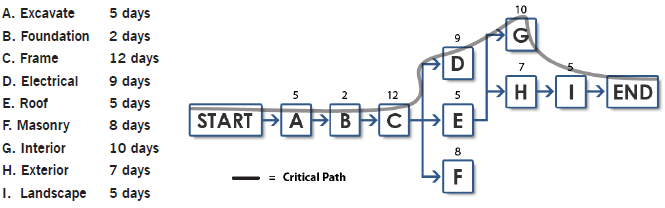
CPM or “Critical Path Method” – It is a tool to analyze project and determine duration, based on identification of “critical path” through an activity network. The knowledge of the critical path can permit project managers to change duration. It is a project modeling technique developed in 1950s and is used with all forms of projects. It displays activities as nodes or circles with known activity times.
A critical path method (CPM) chart is like a network diagram. Basically, all of the steps in the project are connected. You can go through the connected steps to determine which path dictates the longest amount of time to get through the entire end-to-end process.
CPM is a diagram showing every step of the project, as letters with lines to each letter representing the sequence in which the project steps take place. A list of activities is required to complete the project and the time (duration) that each activity will take to complete, along with the sequence and dependencies between activities. CPM lays out the longest path of planned activities to the end of the project as well as the earliest and latest that each activity can start and finish without delaying other steps in the project. The project manager can then, determine which activities in the project need to be completed before others and how long those activities can take before they delay other parts of the project. They also get to know which set of activities is likely to take the longest, also called as the critical path which is also the shortest possible time period in which the project can be completed.
PERT Chart – A PERT chart (program evaluation review technique) is a form of diagram for CPM that shows activity on an arrow diagram. PERT charts are more simplistic than CPM charts because they simply show the timing of each step of the project and the sequence of the activities. In PERT, estimates are uncertain and ranges of duration and the probability that activity duration will fall into that range is taken whereas CPM is deterministic.
A PERT chart is a graphic representation of a project’s schedule, showing the sequence of tasks, which tasks can be performed simultaneously, and the critical path of tasks that must be completed on time in order for the project to meet its completion deadline. The chart can be constructed with a variety of attributes, such as earliest and latest start dates for each task, earliest and latest finish dates for each task, and slack time between tasks. A PERT chart can document an entire project or a key phase of a project. The chart allows a team to avoid unrealistic timetables and schedule expectations, to help identify and shorten tasks that are bottlenecks, and to focus attention on most critical tasks. It is most useful for planning and tracking entire projects or for scheduling and tracking the implementation phase of a planning or improvement effort.
Developing PERT Chart
- Identify all tasks or project components – Ensure the team has knowledge of the project so that during the brainstorming session all component tasks needed to complete the project are captured. Document the tasks on small note cards.
- Identify the first task that must be completed – Place the appropriate card at the extreme left of the working surface.
- Identify any other tasks that can be started simultaneously with task #1 – Align these tasks either above or below task #1 on the working surface.
- Identify the next task that must be completed – Select a task that must wait to begin until task #1(or a task that starts simultaneously with task #1) is completed. Place the appropriate card to the right of the card showing the preceding task.
- Identify any other tasks that can be started simultaneously with task #2 – Align these tasks either above or below task #2 on the working surface.
- Continue this process until all component tasks are sequenced.
- Identify task durations – Reach a consensus on the most likely amount of time each task will require for completion. Duration time is usually considered to be elapsed time for the task, rather than actual number of hours/days spent doing the work. Document this duration time on the appropriate task cards.
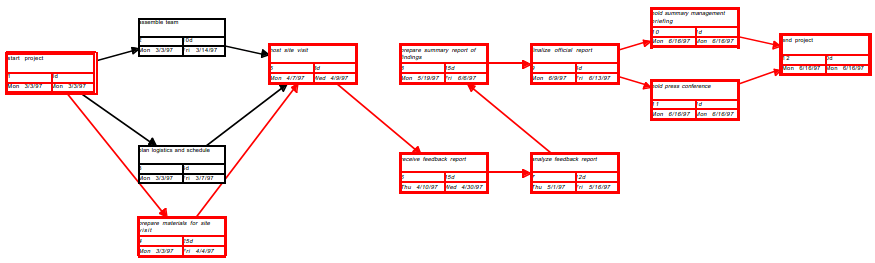
- Construct the PERT chart – Number each task, draw connecting arrows, and add task characteristics such as duration, anticipated start date, and anticipated end date.
- Determine critical path – The project’s critical path includes those tasks that must start or finish on time to avoid delays to the total project. Critical paths are typically displayed in red.
Activity Network Diagram
It charts the flow of activity between separate tasks and graphically displays interdependent relationships between groups, steps, and tasks as they all impact a project. Bubbles, boxes, and arrows are used to depict these activities and the links between them. It shows the sequential relationships of activities using arrows and nodes to identify a project’s critical path. It is similar to the CPM/ PERT and also called as arrow diagram.
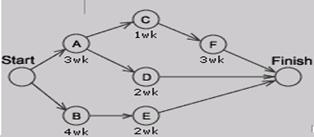
In an activity network diagram (AND), you have a starting activity that kicks off two different concurrent processes, with both processes having the same end point. Each process consists of multiple tasks, each having its own duration.
Developing Activity Network Diagram – Development starts with compiling a list of tasks essential for completion of the project. These tasks are then arranged in a chronological order, depending on the project considering inter-task dependency. All tasks are placed in a progressing line with tasks that can be done simultaneously, is placed on parallel paths, whereas jobs that are dependent should be placed in a chronological line. Apply realistic estimate to each task then, enlist the critical path.
You can use the AND in both the Define and the Improve stages. In the Define stage, you want to understand the “as is” state, which shows how the process is currently being performed. In the Improve stage, you can then decide if there is an opportunity to do some re-engineering, or combine some steps, or do some things differently.
When you examine an AND, the series of steps that dictate the longest cycle time for the project are collectively known as the critical path. So if you have a project with two processes and the first process duration is 10 days and the second process duration is 12 days, the second process is the critical chain or critical path.
