Short and Long Term Capability Indices for Six Sigma- The simplest capability index for Six Sigma is called CP or short term capability index. It compares the width of a two-sided specification to the effective short-term width of the process.
Short-term capability index (CP)
Determining the width between the two rigid specification limits is easy; it is simply the distance between the upper specification limit (USL) and the lower specification limit (LSL). But with variation that trails out at the tails, how do you determine the width of the process?
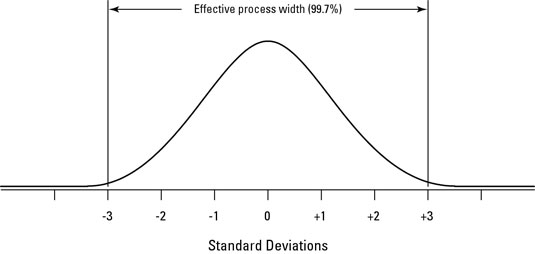
To get over this hurdle, Six Sigma practitioners have defined the effective limits of any process as being three standard deviations away from the average level. At this setting, these limits surround 99.7 percent, or virtually all, of the variation in the process. Figure 13-9 shows these limits graphically.

So to compare the width of the specification to the short-term width of the process, you use the following formula:

where USL – LSL represents the voice of the customer’s requirements and 6σST represents the inherent voice of the process. A calculated CP value equal to 1 means that the voice of the customer is equal to the voice of the process.
A CP value less than 1 means that the process is wider than the specification, with defects spilling out over the edges. A CP value greater than 1 means that the effective width of the process variation is less than the required specification, with fewer defects occurring.
CP is a measure of short-term process or characteristic capability. Use only the short-term standard deviation to calculate its value. Using a long-term standard deviation in its calculation gives you incorrect results.
Adjusted short-term capability index (CPK)
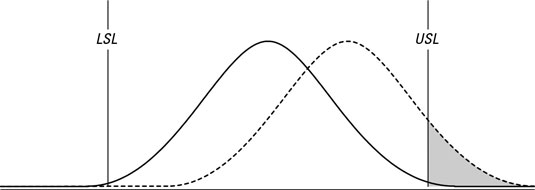
The adjusted short-term capability index (CPK) takes care of a problem with the short-term capability index CP in the preceding section. The issue: Cp compares only the widths of the specification and the process. Figure 13-10 illustrates this problem.

Both the drawn distributions have the same calculated CP. That’s because they both have the same specification width and the same process width. But they aren’t equally capable. Because it’s offset from the center of the specification, the dotted line distribution has many more defects than the solid distribution.
You can compensate for this discrepancy by adjusting the CP calculation for how far it’s off center. To do this, you simply compare the distance from the distribution center to each of the specification limits with the half-width of the short-term variation that should exist between the center of the distribution and the specification limit, like this:

and

The smallest value you calculate of CPU and CPL is the CPK. So you can write the formula for CPK as

where the min in the equation tells you to choose the smallest of the values in parentheses.
If the characteristic or process variation is centered between its specification limits, the calculated value for CPK is equal to the calculated value for CP. But as soon as the process variation moves off the specification center, it’s penalized in proportion to how far it’s offset. CPK is very useful and very widely used.
That’s because it compares the width of the specification with the width of the process while also accounting for any error in the location of the central tendency. This approach is much more realistic than the one the CP method offers.
Usually, CPK larger than 1.33 shows that a process or characteristic is capable in the short term. Values less than 1.33 tell you that the variation is either too wide compared to the specification or that the location of the variation is offset from the center of the specification. It may be a combination of both width and location.
Long-term capability indices (PP and PPK)
The same capability indices that you calculate for short-term variation can also be calculated for long-term, or total, variation. To differentiate them from their short-term counterparts, these long-term capability indices are called PP and PPK. (The P stands for “performance.”)
The only difference in their formulas is that you use σLT in place of σST. These long-term capability indices are important because no process or characteristic operates in just the short term. Every process extends out over time to create long-term performance.
Prescribe a capability improvement plan
How can you use the short- and long-term capability indices of a process or characteristic to chart out a plan for improvement? Table 13-5 outlines the various scenarios that may occur when you’re measuring the capability of a process or characteristic and describes an improvement plan for each scenario.
| Symptom | Diagnosis | Prescription |
|---|---|---|
| CP = CPKand PP = PPK | Overall, your process or characteristic is centered within its specifications. | As needed, focus on reducing the long-term variation in your process or characteristic while maintaining on-center performance. |
| CP = PPand CPK= PPK | Your process or characteristic suffers from a consistent offset in its center location. | Focus on correcting the set point of your process or characteristic until it’s centered. |
| CP = PPK | Your process is operating at its entitlement level of variation. | Continue to monitor the capability of your process. Redesign your process to improve its entitlement level of performance. |
Test Your Six Sigma Black Belt Skills By Taking Our Practice Tests on This Link
Become Vskills Certified Six Sigma Black Belt Professional. Learn the module “Short-term and Long-term Capability”. Try the free practice test!
Apply for Six Sigma Black Belt Certification Now!!
http://www.vskills.in/certification/Certified-Six-Sigma-Black-Belt-Professional


