Robust design processes can produce extremely reliable designs both during manufacture and in use. Robust design uses the concept of parameter control to place the design in a position where random “noise” does not cause failure. Dr. G. Taguchi wrote that the United States has coined the term “Taguchi Methods” to describe his system of robustness for the evaluation and improvement of the product development processes.
Robust design aims to produce a reliable design by controlling parameters so random noise does not cause failure. Since DOE techniques help determine the best design concepts used for tolerance design, a robust DOE strategy helps create a design that improves the product parameters, process parameters, and desired performance characteristics. A product or process is controlled by three primary factors of noise, signal, and control.
The robust concept illustrates that a product or process is controlled by a number of factors to produce the desired response. The signal factor is the signal used for the intended response. The success of obtaining the response is dependent on control fact ors and noise factors.
Control factors are those parameters that are controllable by the designer that operate to produce a response when triggered by a signal. Control factors are separated into those which add no cost and those that do add cost. Factors that add cost are frequently associated with selection of the tolerance of the components and are called Tolerance Factors. Factors that don’t add cost are simply control factors. Noise factors are parameters or events that are not controllable by the designer and are generally random.
Noise factors have the ability to produce an error in the desired response. The function of the designer is to select control factors so that the impact of noise factors on the response is minimized while maximizing the response to signal factors.
Some of the key principles of robust design are
- Concept Design – The selection of the process or product architecture is based on technology, cost, customer, or other considerations.
- Parameter Design – The design is established using the lowest cost components and techniques. The response is then optimized for control and minimized for noise.
- Tolerance Design – The tolerances are reduced until the design requirements are met.
Functional Requirements
In the development of a new product, the product planning department must determine the functions required. The designer will have a set of requirements that a new product must possess. The designer will develop various concepts, embodiments, or systems that will satisfy the customer’s requirements.
Functional requirements are the requirement the product or process must possess to satisfy the customer’s requirements. They need to be understood early in the design process in order to establish criteria for selecting a design based on the quality level and development costs that enable the product to survive in a competitive marketplace. Along with establishing the functional requirement early in the process, they must yield accurate information. Misinformation about them can delay the development cycle. Examples of it are car must have average of 25 Km/ltr in city, alarm beep must activate when the temperature exceeds 30o C, etc
The product design must be “functionally robust,” which implies that it must withstand variation in input conditions and still achieve desired performance capabilities. The designer has two objectives
- Develop a product that can perform the desired functions and be robust under various operating or exposure conditions.
- Have the product manufactured at the lowest possible cost.
Parameter Design
Parameter designs improve the functional robustness of the process so that the desired dimensions or quality characteristics are obtained. The process is considered functionally robust if it produces the desired part for a wide variety of part dimensions. The steps to obtain this robustness are
- Determine the signal factors (input signals) and the uncontrollable noise factors (error factors) and ranges.
- Choose as many controllable factors as possible, select levels for these factors, and assign these levels to appropriate orthogonal arrays.
- Calculate S/N ratios from the experimental data.
- Determine the optimal conditions for the process derived from the experimental data.
- Conduct actual production runs.
Noise Factors
They are all the uncontrolled sources producing variation throughout the product’s life and across production units, except variables in design parameters. There are two types of noise factors
- External noise sources are variables that are external to the product affecting its performance.
- Internal noise sources are the product’s deviations from its nominal settings, including worker/machine and environmental conditions.
In baking, the use of sugar, butter, eggs, milk, and flour are controllable factors, whereas the conditions inside the oven such as humidity and temperature are not controllable. Motor vehicle tires encounter external noise through exposure to a variety of conditions such as surface conditions due to weather (damp, wet, snow, ice), different temperature, and different road types (concrete, asphalt, gravel, dirt, and off road). The ability of tires to provide a smooth ride and responsive stopping regardless of the conditions is an example of robustness.
Noise factors are difficult, expensive, or impossible to control. In the past, many engineers approached noise problems by attempting to control the noise factors themselves. Because of the expense, Dr. Taguchi suggests designers should only use this type of control action as a last resort, and he recommends an experimental approach to seek the design parameters to minimize the impact of the noise factors on variation.
This approach drives the designer to select the appropriate control settings that will make the product unaffected by noise factors, thus robust. Remember, the goal of robustness strategies is to achieve a given target with minimal variation. Lack of robustness is synonymous with excessive variation, resulting in quality loss. Ignoring noise factors during the early design stages can result in product failures and unanticipated costs; therefore addressing noise factors early in the process through robust design minimizes these problems.
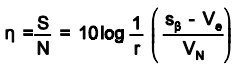
Signal-to-Noise Ratio – A signal-to-noise ratio or S/N ratio is used to evaluate system performance. The combinations of the design variables that maximize the S/N ratio are selected for consideration as product or process parameter settings.
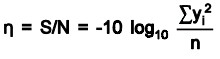
Case 1 – S/N ratio for “smaller-is-better”: S/N = -10 log(mean-squared response)
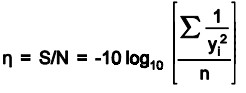
Case 2 – S/N ratio for “larger-is-better”: S/N = -10 log(mean-squared of the reciprocal response)
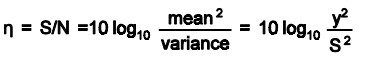
Case 3 – S/N ratio for “nominal-is-best”:
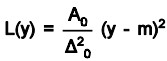
The Loss Function – The loss function is used to determine the financial loss that will occur when a quality characteristic, y, deviates from the target value, m. The quality loss is zero when the quality characteristic, y, is at the target value, m. The quality loss function is defined as the mean square deviation of the objective characteristics from their target values. The function is depicted as
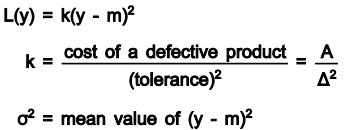
The function L(y) shows that the further away from the target, the quality characteristic is, the greater the quality loss. The “A” value is the cost due to a defective product. The amount of deviation from the target, or “tolerance” as Taguchi calls it, is the delta (![]() ) value. The mean square deviation from the target (
) value. The mean square deviation from the target ( ![]() ), as used by Taguchi, does not indicate a variance.
), as used by Taguchi, does not indicate a variance.
Noise Strategies
The design engineers will specify the design parameters of the chosen system for improved quality and reduced cost. A variety of tools are used to make the new system robust to various factors. Primary sources of variation that will affect the product
- Environmental effects
- Deteriorative effects
- Manufacturing imperfections
The purpose of robust design is to make the product less sensitive to the effects. It is not economical to reduce these sources of variation directly. The design & development department will shoulder the major responsibility for reducing sources of variation (noise).
Tolerance Design
Tolerance is a permissible limit of variation in a parameter’s dimension or value. Dimensions and parameters may vary within certain limits without significantly affecting the equipment’s function. Designers specify tolerances with a target and specification limits (upper and lower) to meet customer requirements. The tolerance range, the difference between those limits, is the permissible limit of variation. Systems are made of components, and components are made of materials. Realistically, not all components are made of the same materials. Designers must determine the tolerances for all system components.
Tolerance design establishes metrics allowing designers to identify the tolerances that can be loosened or tightened to meet customer needs while producing a cost-effective product. Tolerance design goes a step beyond parameter design by considering tolerance decisions as economic decisions just as spending additional money buys better materials or equipment. Besides economics, tolerance design also considers other factors such as constraints due to material’s properties, engineering design choice and safety factors. By enhancing the understanding of the relationship between product parameters, process parameters, and desired performance characteristics, designers use DOE to identify what is significant and move the process or product to the ideal function.
The tolerances for all system components must be determined. This includes the types of materials used. In tolerance design, there is a balance between a given quality level and cost of the design. The measurement criteria are quality losses. Quality losses are estimated by the functional deviation of the products from their target values plus the cost due to the malfunction of these products. Taguchi describes the approach as using economical safety factors.
The functional limit m![]() ust be determined by methods like experimentation and testing. Taguchi uses a LD50 point as a guide to establish the upper and lower functional limits. The LD50 point is where the product will fail 50% of the time. The 50% point is called the median.
ust be determined by methods like experimentation and testing. Taguchi uses a LD50 point as a guide to establish the upper and lower functional limits. The LD50 point is where the product will fail 50% of the time. The 50% point is called the median.
The formulas for tolerance specifications, the functional limit, and safety factors are as
Tolerance Specifications –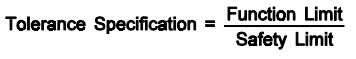
Functional Limit –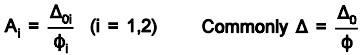
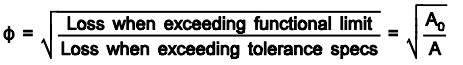
The economical safety factor N, is determined as follows
Given the value of the quality characteristic at y, and the target value at m, the quality loss function will appear as
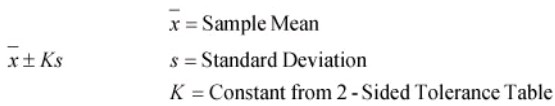
Statistical Tolerance
Parts work together, fit into one another, interact together and bond together. Since each part has its own tolerance, statistical tolerance is a way to determine the tolerance of an assembly of parts. By using sample data from the process, statistical tolerance defines the amount of variance in the process. Statistical tolerance is based on the relationship between the variances of independent causes and the variance of the overall results.
According to Thomas Pyzdek, engineering tolerances are usually set without knowing which manufacturing process will be used to manufacture the part, so the actual variances are not known. However, a worst case scenario would be where the process was just barely able to meet the engineering requirement. This situation occurs when the engineering tolerance is 6 standard deviations wide (± 3 standard deviations). Thus, we can write the equation as
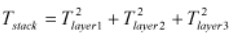
Pyzdek asserts, instead of simple addition of tolerances, the squares of the tolerances are added to determine the square of the tolerance for the overall result.” Pyzdek goes on to say, “The result of the statistical approach is a dramatic increase in the allowable tolerances for the individual piece parts.” This is an important concept in terms of tolerance because now the parts can have a greater tolerance for each part. Pyzdek uses the following assumptions
- The component dimensions are independent and the components are assembled randomly. This assumption is usually met in practice.
- Each component dimension should be approximately normally distributed.
- The actual average for each component is equal to the nominal value stated in the specification.
Tolerance Design and Process Capability
Customers always have requirements. To meet those requirements, we assign products and processes certain specifications and a target. As the products deviate from the target, quality losses grow. Functional requirements (FRs) are the requirement the product or process must have to satisfy the customer. Tolerance is a permissible limit of variation in a dimension or value of the parameter.
Linking tolerance and process capability is about linking functional requirements and tolerances to the economic safety factor. Three situations are forthcoming
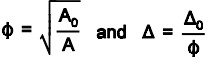
Smaller-is-Better Tolerances – The formulas for calculating tolerances are
Larger-is-Better Tolerances – In larger-is-better situations, the quality characteristics are also nonnegative and should be as large as possible. The economical safety factor is calculated as

The tolerance specification for a larger-is-better tolerance is ![]() where, is the tolerance specification required and
where, is the tolerance specification required and ![]() is the functional limit.
is the functional limit.
The quality characteristic, for the larger-is-better situation, is designated as y and the loss function is L(y). When y is infinite, L(y) is zero. A new equation for the average loss function L(y) is
Taguchi’s Quality Imperatives
They are summarized as
- Robustness is a function of product design. Quality losses are a loss to society.
- Increasing the signal-to-noise ratio will improve the robustness of the product.
- For new products, use planned experiments to seek out the parameter targets.
- To build robust products, use customer-use conditions.
- Tolerances are set before going to manufacturing. The quality loss function can be measured.
- Products that barely meet the standard are only slightly better than products that fail the specifications. The aim is for the target value.
- The factory must manufacture products that are consistent by reducing variation.
- Reducing product field failures will reduce the number of defectives in the factory. Part variation reduction decreases system variation.
- Proposals for capital equipment for on-line quality efforts should include the average quality loss.
