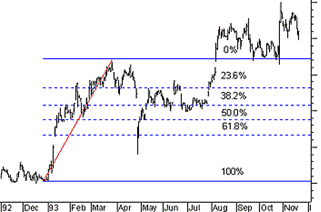
Fibonacci Retracements are displayed by first drawing a trend line between two extreme points, for example, a trough and opposing peak. A series of nine horizontal lines are drawn intersecting the trend line at the Fibonacci levels of 0.0%, 23.6%, 38.2%, 50%, 61.8%, 100%, 161.8%, 261.8%, and 423.6. After a significant price move, up or down, prices will often retrace a significant portion of the original move. As prices retrace, support and resistance levels often occur at or near the Fibonacci Retracement levels. In the following chart, Fibonacci Retracement lines were drawn between a major trough and peak. It can be seen that support and resistance occurred near the Fibonacci levels of 23 and 38%.

Apply for Technical Analysis Certification Now!!
http://www.vskills.in/certification/Certified-Technical-Analyst

