Regression analysis is a statistical process and, as used in sales forecasting, determines and measures the association between company sales and other variables. It involves fitting an equation to explain sales fluctuations in terms of related and presumably causal variables, substituting for these variables values considered likely during the period to be forecasted, and solving for sales. In other words, there are three major steps in forecasting sales through regression analysis:
- Identify variables causally related to company sales.
- Determine or estimate the values of these variables related to sales.
- Derive the sales forecast from these estimates.
Computers make it easy to use regression analysis for sales forecasting. One tyre manufacturer, for instance, used simple regression analysis to determine the association between economic variables and its own sales. This company discovered that a positive correlation existed between gross national product and its own sales, but the correlation coefficient was too low to use in forecasting company sales. The same was true of personal disposable income and retail sales; their correlation coefficients with company sales were too low to use in forecasting company sales.
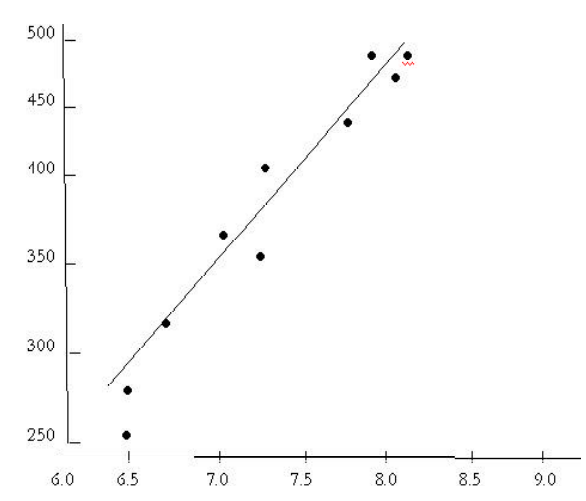
Automobile sales (millions of units)
The tyre manufacturer measured the relationship between its own dollar sales and unit sales of automobiles and found a much higher degree of correlation. The dots on this scatter diagram cluster closely around the straight line that is the result of the mathematical computation between the two series of data. If the correlation had been perfect, all the dots would have fallen on the line.
Where sales are influenced by two or more independent variables acting together multiple regression techniques are used.
Evaluation of regression analysis for sales forecasting: If high coefficients of correlation exist between company sales and independent variables, the forecasting problem is simplified, especially if the variables “lead” company sales. The probable course of sales may then be charted, and the forecaster can concentrate on factors that might cause deviations. But it is necessary to examine other circumstances that might upset past relationships. A forecast made through regression analysis assumes that past relations will continue. A “lead-lag” association in which deviations regularly occur in related independent variable(s) prior to a change in company sales is a near-ideal situation, but it rarely holds except over short periods. Lead-lag relationships are common, but associations between the lead variables and sales in which the intervening time intervals remain stable are uncommon. Periods not only contract or expand erratically; they vary greatly during different phases of the business cycle.
If close associations exist between company sales and a reliable barometer, estimates are improved by experts’ predictions of probable changes in the barometer. However, one danger in using regression analysis is that forecasters may put too much faith in the statistical output. They may abandon independent appraisals of future events because of a statistically developed forecast. It is wrong to place blind faith in any forecasting method. It is wise to check results with those of other forecasts.
