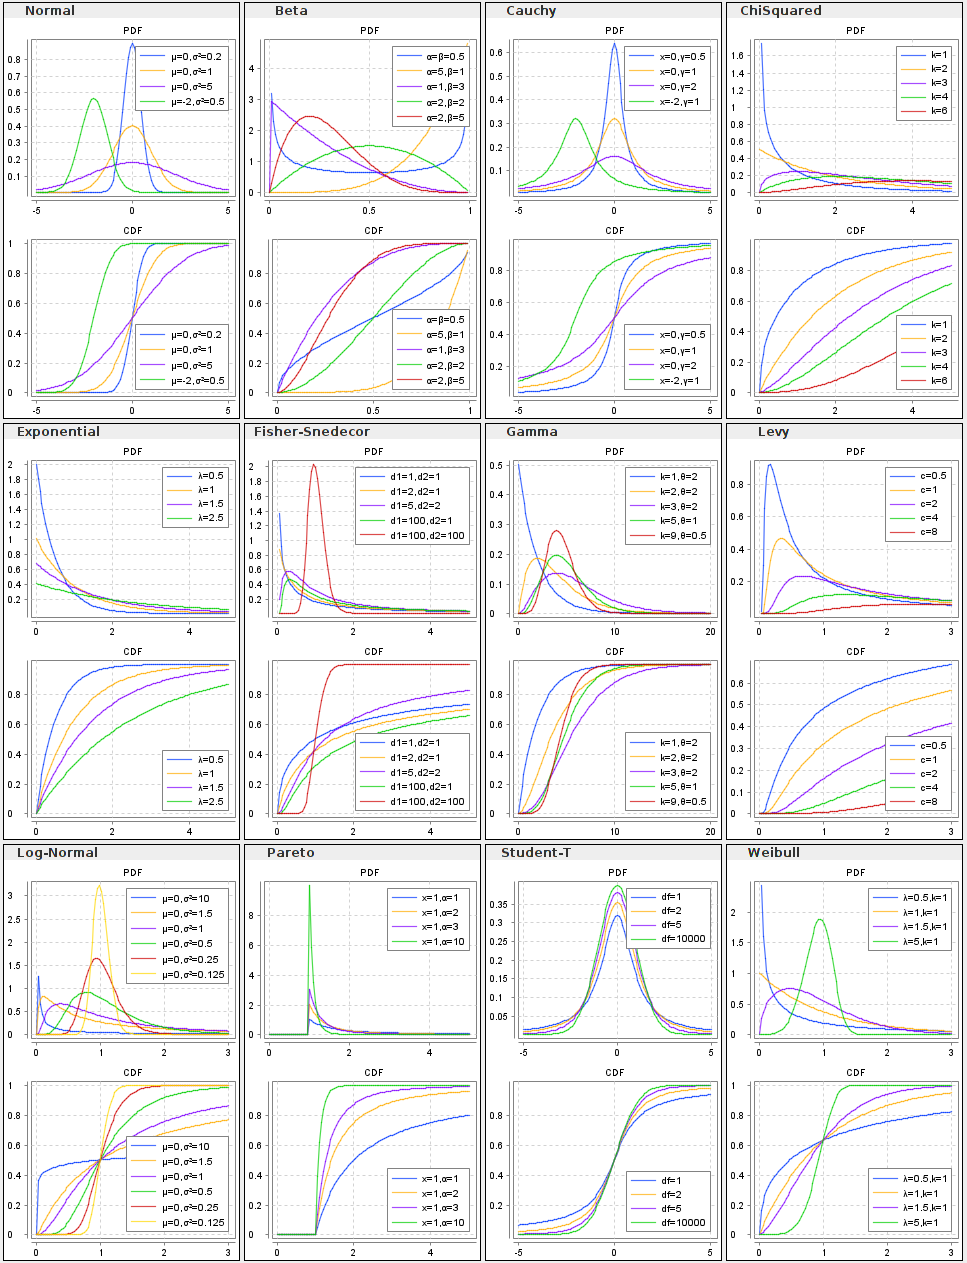
Probability Distributions- Distribution – Prediction and decision-making needs fitting data to distributions (like normal, binomial, or Poisson).
Probability Distribution
It is a mathematical formula relating the values of a characteristic or attribute with their probability of occurrence in the population.
Probability Density Function
Probability distributions for continuous variables use probability density functions (or PDF), which are mathematically model the probability density shown in a histogram but, discrete variables have probability mass function.
Distributions Types
Various distributions are –
- Binomial – It is used in finite sampling problems when each observation has only one of two possible outcomes, such as pass/fail.
- Poisson – It is used for situations when an attribute possibility is that each sample can have multiple defects or failures.
- Normal – It is characterized by the traditional “bell-shaped” curve, the normal distribution is applied to many situations with continuous data that is roughly symmetrical around the mean.
- Chi-square – It is used in many situations when an inference is drawn on a single variance or when testing for goodness of fit or independence. Examples of use of this distribution include determining the confidence interval for the standard deviation of a population or comparing the frequency of variables.
- Student’s t – It is used in many situations when inferences are drawn without a variance known in the case of a single mean or the comparison of two means.
- F-Test – It is used in situations when inferences are drawn from two variances such as whether two population variances are different in magnitude.
- Hypergeometric – It is the “true” distribution. It is used in a similar manner to the binomial distribution except that the sample size is larger relative to the population. This distribution should be considered whenever the sample size is larger than 10% of the population. The hypergeometric distribution is the appropriate probability model for selecting a random sample of n items from a population without replacement and is useful in the design of acceptance-sampling plans.
- Bivariate – It is created with the joint frequency distributions of modeled variables.
- Exponential – It is used for instances of examining the time between failures.
- Lognormal – It is used when raw data is skewed and the log of the data follows a normal distribution. This distribution is often used for understanding failure rates or repair times.
- Weibull – It is used when modeling failure rates particularly when the response of interest is percent of failures as a function of usage (time).
Take Free Mock Test on Six Sigma Green Belt
Apply for the Certification Exam !!


