Measures of Shape
Measures of shape define the distribution of the data in a dataset. And, the distribution shape of quantitative data means that there is a logical order to the values. Moreover, then there can be the identification of the ‘low’ and ‘high’ end values on the x-axis.
Rise and drop of distribution in measures of shape
For distributions summarizing data from continuous measurement scales, statistics can be used to describe how the distribution rises and drops.
Symmetric
Symmetric means if the distributions having the same shape on both sides of the center. Moreover, those with only one peak are known as a normal distribution.
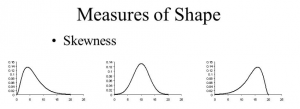
Skewness
Skewness refers to the degree of asymmetry in a distribution. And, asymmetry reflects extreme scores in a distribution. Moreover, it includes positive and negative skewness.
- Positively skew
It is when it has a tail extending out to the right so, the mean is greater than the median and the mean is sensitive to each score in the distribution. Moreover, it is subject to large shifts when the sample is small and contains extreme scores.
- Negatively skew
Negative skew has an extended tail pointing to the left and reflects bunching of numbers in the upper part of the distribution. Moreover, it has fewer scores at the lower end of the measurement scale.
Learn and enhance your knowledge about the measure of shape. Become a Certified TQM Professional Now!


