SPSS means “Statistical Package for the Social Sciences” and was first launched in 1968. Since SPSS was acquired by IBM in 2009, it’s officially known as IBM SPSS Statistics but most users still just refer to it as “SPSS”.
SPSS is software for editing and analyzing all sorts of data. These data may come from basically any source: scientific research, a customer database, Google Analytics or even the server log files of a website. SPSS can open all file formats that are commonly used for structured data such as
- spreadsheets from MS Excel or OpenOffice;
- plain text files (.txt or .csv);
- relational (SQL) databases;
- Stata and SAS.
SPSS Interface
SPSS utilizes multiple types of windows, or screens, in its basic operations. Each window is associated with specific tasks and types of SPSS files. The windows include the Data Editor, Output Viewer, Syntax Editor, Pivot Table Editor, Chart Editor, and Text Output Editor. The following sections describe the basic purposes and functions of the three most common windows—the Data Editor, Output Viewer, and Syntax Editor—since these three windows are integral for most every action performed in the program. The other windows are relevant to more specific types of tasks.
Data Editor
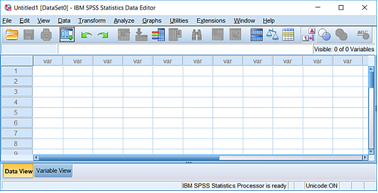
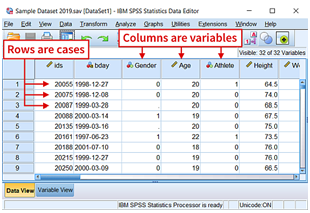
The Data Editor window is the default window and opens when SPSS starts. This window displays the content of any open data files and provides drop-down menus that allow you to modify and analyze data. The data are displayed in a spreadsheet format where columns represent variables and rows represent cases. The spreadsheet format includes two tabs at the bottom labeled Data View and Variable View. The Data View tab displays the open data set: variables appear in columns, and cases appear in rows. The Variable View tab displays information about variables in the open data (but not the data themselves), such as variable names, types, and labels, etc.

Output Viewer
When you perform any command in SPSS, the Output Viewer window opens automatically and displays a log of the actions taken and the associated output. Primarily, the Output Viewer is where the results of statistical analysis are shown, but any command invoked through the drop-down menus or syntax will be printed to the Output Viewer. This includes opening, closing, or saving a data file. If an Output Viewer window is not open when a command is run, a new Output Viewer window will automatically be created.

The Output Viewer window is divided into two sections, or frames. The left frame contains an outline of the content in the Output Viewer. This outline is especially useful when you have run many SPSS commands and need to locate a particular section of output easily. The right frame contains the actual output. Clicking on an item in the left frame will jump to that content in the right frame. Items that have been selected in the right frame are indicated by a red arrow and a box drawn around the content.
You can modify the contents in the Output Viewer by selecting items in the left or right frame and copying, pasting, or deleting them. To remove an item from the Output Viewer, click on its name in the left frame or click on the object itself in the right frame, then press the Delete key on your keyboard.
An Output Viewer window can be saved as a viewer file (*.spv) so that you can review it again without having to re-run the same commands in SPSS. To save an Output Viewer window, click File > Save As. Alternatively, you can export some or all of the contents in the Viewer window to a new document or image file by clicking File > Export. In general, you can export all content as a PDF (*.pdf), a PowerPoint file (*.ppt), an Excel file (*.xls or *.xlsx), a Word file (*.doc or *.docx), an HTML file (*.htm), or a text file (*.txt). Graphs can be saved as *.bmp, *.emf, *.eps, *.jpeg, *.png, or *.tif.
Syntax Editor
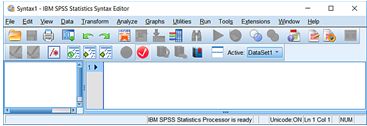
SPSS syntax is a programming language unique to SPSS that can be used as an alternative to the drop-down menus for data manipulation and statistical analyses. The Syntax Editor window is where users can write, debug, and execute SPSS syntax. To open a new Syntax Editor window, click File > New > Syntax.
The right panel of the Syntax Editor window is where your syntax is entered. The left panel of the Syntax Editor window shows an outline of the commands in your syntax, and can be used to navigate within your code. You can jump to a specific part of your code by clicking on the command in the left panel. This feature is useful for showing the start and end points of a command, especially if the command is longer than one line

SPSS Data View Window
When you view data in SPSS, each row in the Data View represents a case, and each column represents a variable.
Cases represent independent observations, experimental units, or subjects. For example, if the data are based on a survey of college students, then each row in the data would represent a specific college student who participated in the study.
Variables are attributes, characteristics, or measurements that describe cases. For example, your data might include information such as each college student’s date of birth, gender, or class rank. Each of these pieces of information is a variable that describes each case (college student).

SPSS Syntax
SPSS syntax is a programming language unique to SPSS that allows you to perform analysis and data manipulation in ways that would be tedious, difficult, or impossible to do through the drop-down menus. Syntax allows users to perform tasks that would be too tedious or difficult to do using the drop-down menus. This is the case when you are re-running the same analysis many times, or doing complex transformations on data. Syntax also provides a record of how you transformed and analyzed your data, and allows you to instantly reproduce those steps at any time.
Syntax Rules
Formatting
- Statements in SPSS end with a period.
- SPSS syntax is not case-sensitive. You can use all lower case, all upper case, or a mixture of both when writing syntax.
Comments
A comment is a line of text in a program that is not read by the computer as a command. In SPSS syntax, placing an asterisk (*) or a forward-slash followed by an asterisk (/*) at the start of a line will turn all text on that line into a comment.
Color-Coding
By default, SPSS uses color and bolding to indicate the roles of the words in the syntax.
| Color Coding | SPSS Syntax |
| Dark blue/purple | Procedure names; execution statements |
| Green | Statements associated with the given procedure |
| Dark red/orange | Option keywords |
| Gray | Comments |
| Black | Variable names; other text |
Executing Syntax Commands
To execute (or run) the commands, highlight the lines you want to run, then click Run > Selection, or press Ctrl + R on your keyboard.
Saving Syntax Files
You can save your SPSS syntax as an *.sps file so that you can re-use it later. To save your syntax file, make sure that you have the Syntax Editor window open and active, then click File > Save or File > Save As to save the syntax file.
Journal Files
By default, SPSS conveniently records the syntax for all of the commands run in SPSS (whether you used drop-down menus or syntax) in a Journal File (extension “.jnl”). This is convenient if you wish to review what commands you ran or if you want to edit or save the syntax commands for future use.
Data Creation in SPSS
When you open the SPSS program, you will see a blank spreadsheet in Data View. If you already have another dataset open but want to create a new one, click File > New > Data to open a blank spreadsheet.
You will notice that each of the columns is labeled “var.” The column names will represent the variables that you enter in your dataset. You will also notice that each row is labeled with a number (“1,” “2,” and so on). The rows will represent cases that will be a part of your dataset. When you enter values for your data in the spreadsheet cells, each value will correspond to a specific variable (column) and a specific case (row).
Importing Data into SPSS
If you already have data that are in an SPSS file format (file extension “.sav”), you can simply open that file to begin working with your data in SPSS. However, if you have data stored in other types of files, such as an Excel spreadsheet or a text file, you will need to instruct SPSS how to read the file and then save it in the SPSS file format (“.sav”).
Importing Data from an Excel File
To import data from an Excel spreadsheet into SPSS, first make sure your Excel spreadsheet is formatted according to these criteria:
- The spreadsheet should have a single row of variable names across the top of the spreadsheet in the first row.
- Variable names should include ordinary letters, numbers, and underscores (e.g., Gender, Grad_Date, Test_1) and not include special characters (e.g., “Graduation Date” would not be a valid variable name because it contains a space).
- The data should begin in the first column, second row (beneath the variable names row) of the spreadsheet.
- Anything that is not part of the data itself (e.g., extra text, labels, graphs, Pivot Tables) should be removed.
- Missing values for string or numeric variables have blank (empty) cells, or an appropriate predetermined missing value code (such as -999).
Working with Variables
Most of the time, you’ll need to make modifications to your variables before you can analyze your data. These types of modifications can include changing a variable’s type from numeric to string (or vice versa), merging the categories of a nominal or ordinal variable, dichotomizing a continuous variable at a cut point, or computing a new summary variable from existing variables. This section will focus on transformations applied to individual variables, particularly recoding and computing new variables.
- Computing Variables – The “Compute Variable” command allows you to create new variables from existing variables by applying formulas. Compute Variable command can compute a variable using an equation, a built-in function, or conditional logic.
- Recoding (Transforming) Variables – Recoding a variable can be used to transform an existing variable into a different form based on certain criteria.
- Automatic Recode – If you have a string variable and have used blanks to indicate missing values, you may notice that SPSS does not automatically recognize the blank observations as missing. To fix this, you’ll need to use Automatic Recode. More broadly, Automatic Recode is also used to quickly convert a string categorical variable into a numeric categorical variable.
Data Management
Managing a dataset often includes tasks such as sorting data, subsetting data into separate samples, merging multiple sources of data, aggregating of data based on some key indicator, or restructuring a dataset. These types of data management tasks are sometimes called data cleaning, data munging, or data wrangling. This section covers these types of “cleaning” tasks.
- Sorting Data – Sorting a dataset rearranges the rows with respect to one or more variables. Sorting makes it convenient for reading the data; additionally, several SPSS procedures require the data to be sorted in a certain way before the procedure can run.
- Splitting Data – In SPSS, the “Split File” command can be used to organize statistical results into groups for comparison. Split File is used when you want to run statistical analyses with respect to different groups, but don’t necessarily want to separate your data into two different files.
- Weighting Cases – Sometimes, you don’t have raw data available to you — you may only have a frequency table indicating the types of responses and how many times they occurred. Alternatively, you may be working with a dataset that contains a weighting variable.
- Partitioning Data – (Coming soon) The Select Cases procedure is used when you want to create a new dataset by extracting cases from an existing dataset. Unlike the Split File option, Select Cases affects the data itself, rather than the output.

