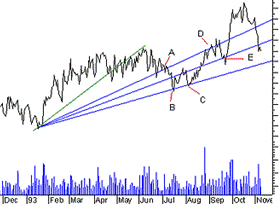
Fibonacci Fan Lines are displayed by drawing a trend line between two extreme points, for example, a trough and opposing peak. Then an “invisible” vertical line is drawn through the second extreme point. Three trend lines are then drawn from the first extreme point so they pass through the invisible vertical line at the Fibonacci levels of 38.2%, 50.0%, and 61.8%.
The following chart of shows how prices found support at the Fan Lines. One can see that when prices encountered the top Fan Line (point “A”), they were unable to penetrate the line for several days. When prices did penetrate this line, they dropped quickly to the bottom Fan Line (points “B” and “C”) before finding support. Also note that when prices bounced off the bottom line (point “C”), they rose freely to the top line (point “D”) where they again met resistance, fell to the middle line (point “E”) and rebounded.

Apply for Technical Analysis Certification Now!!
http://www.vskills.in/certification/Certified-Technical-Analyst

