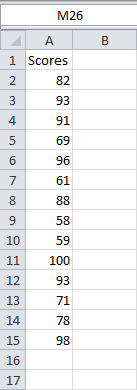
Perhaps the most common Data Analysis tool that you’ll use in Excel is the one for calculating descriptive statistics. To see how this works, for example, you may have the scores of 14 participants for a test.

To generate descriptive statistics for these scores, execute the following steps.
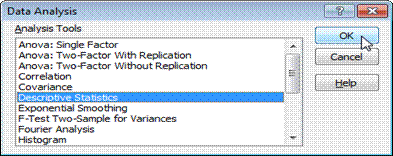
- On the Data tab, click Data Analysis.

- Select Descriptive Statistics and click OK.

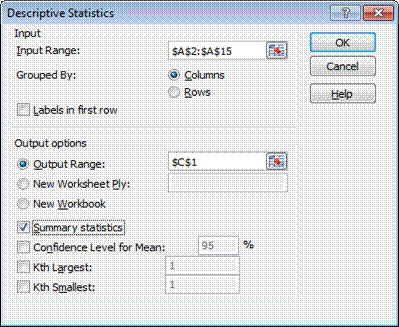
- Select the range A2:A15 as the Input Range.
- Select cell C1 as the Output Range.
- Make sure Summary statistics is checked.

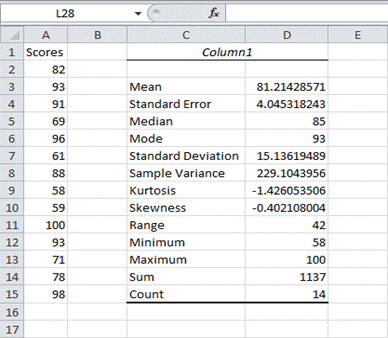
Click OK and the result is as

Here are the statistics that Excel calculates.
| Statistic | Description |
| Mean | Shows the arithmetic mean of the sample data. |
| Standard Error | Shows the standard error of the data set (a measure of the difference between the predicted value and the actual value). |
| Median | Shows the middle value in the data set (the value that separates the largest half of the values from the smallest half of the values). |
| Mode | Shows the most common value in the data set. |
| Standard Deviation | Shows the sample standard deviation measure for the data set. |
| Sample Variance | Shows the sample variance for the data set (the squared standard deviation). |
| Kurtosis | Shows the kurtosis of the distribution. |
| Skewness | Shows the skewness of the data set’s distribution. |
| Range | Shows the difference between the largest and smallest values in the data set. |
| Minimum | Shows the smallest value in the data set. |
| Maximum | Shows the largest value in the data set. |
| Sum | Adds all the values in the data set together to calculate the sum. |
| Count | Counts the number of values in a data set. |
| Largest(X) | Shows the largest X value in the data set. |
| Smallest(X) | Shows the smallest X value in the data set. |
| Confidence Level(X) Percentage | Shows the confidence level at a given percentage for the data set values. |

