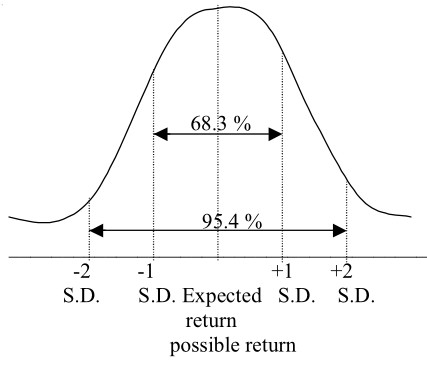
The probability distribution of returns on Mercury Co. Ltd. And Zenith Co. Ltd. Is a discrete distribution because probabilities have been assigned to a finite number of specific values. In finance, probability distributions are commonly regarded as continuous, even though they may actually be discrete. In this case, probabilities are assigned to intervals between two points on a continuous curve. e.g. What is the probability that rate of return will fall between 25% and 50%? The Normal Distribution, a continuous probability distribution, is the most commonly used probability distribution in finance. The normal distribution resembles a bell shaped curve. It appears that stock returns, at least over short time intervals are approximately normally distributed. The following are the features of a normal distribution:
- It is completely characterized by just two parameters viz. Expected return and standard deviation of return.
- A bell shaped distribution; it is perfectly symmetric around the expected return.
- The probabilities for values lying within certain bands are as follows:
Band Probability
+ 1 S.D 68.3 %
+ 2 S.D 95.4 %
+ 3 S.D 99.7 %
The same can be represented graphically as follows:


