Data Analytics is the backbone of modern decision-making, driving insights from raw data to foster strategic planning and operational efficiency. Among the various tools available, Microsoft Excel remains one of the most accessible and versatile platforms for data analytics. Its wide array of features, simplicity, and user-friendliness make it an indispensable tool for professionals, students, and businesses.
What Do Data Analytics Professionals Do?
Data analytics professionals play a pivotal role in helping organizations make informed decisions. They transform raw data into meaningful insights using analytical techniques, tools, and methodologies. Here’s an overview of their key responsibilities:
1. Data Collection and Management
- Gathering Data: Collecting data from various sources such as databases, surveys, APIs, and logs.
- Organizing Data: Structuring and storing data to make it accessible and usable.
- Data Cleaning: Identifying and correcting errors, inconsistencies, and missing values to ensure data quality.
2. Data Analysis
- Exploratory Data Analysis (EDA): Examining datasets to uncover patterns, trends, and relationships.
- Statistical Analysis: Applying mathematical models to analyze data, such as regression, hypothesis testing, and clustering.
- Trend Analysis: Identifying historical trends to predict future outcomes.
3. Data Visualization
- Creating Reports: Designing dashboards, charts, and graphs to present data in a visually appealing and understandable format.
- Storytelling with Data: Turning complex datasets into actionable stories that support decision-making.
- Interactive Visuals: Building interactive dashboards using tools like Tableau, Power BI, or Excel.
4. Problem-Solving and Insights
- Identifying Problems: Recognizing inefficiencies or issues in processes through data-driven analysis.
- Generating Insights: Providing actionable recommendations to improve business outcomes, such as increasing revenue, reducing costs, or enhancing customer satisfaction.
5. Collaboration
- Working with Teams: Collaborating with stakeholders, managers, and other departments to understand their data needs.
- Data Communication: Translating technical data insights into business-friendly language for decision-makers.
6. Automation and Optimization
- Streamlining Processes: Using tools and scripts to automate repetitive tasks.
- Improving Systems: Optimizing business operations based on analytical findings.
7. Predictive and Prescriptive Analytics
- Predictive Analytics: Using historical data and machine learning to forecast future trends.
- Prescriptive Analytics: Recommending specific actions based on predictive models to achieve desired outcomes.
Key Tools Used:
- Excel: For basic analysis and visualization.
- SQL: To query and manage large datasets.
- Python/R: For advanced analytics and data manipulation.
- Visualization Tools: Tableau, Power BI, or Google Data Studio.
- Big Data Platforms: Hadoop, Spark for handling large datasets.
Career Paths for Data Analytics Professionals:
- Data Analyst: Focuses on exploring and visualizing data for actionable insights.
- Business Analyst: Uses data to align business strategies and operations.
- Data Scientist: Performs advanced analytics using machine learning and statistical models.
- BI Analyst: Specializes in creating and maintaining business intelligence solutions.
- Data Engineer: Manages and optimizes the infrastructure for large-scale data processing.
Data analytics professionals are the bridge between raw data and impactful decisions, making them integral to the success of modern organizations. They don’t just analyze numbers—they provide clarity, direction, and measurable value.
Vskills Certificate in Data Analytics Using Excel: Overview
The Vskills Data Analytics Using Excel certification is an excellent opportunity to enhance your career prospects and sharpen your analytical abilities. This certification provides you with key data manipulation, analysis, and visualization skills using Excel, a versatile tool popular across various industries. It is particularly beneficial for professionals aiming to make data-driven decisions and distinguish themselves in today’s data-focused job market.
Vskills, India’s leading certification provider, offers candidates access to top-notch exams along with valuable post-exam benefits, including:
- Government-verified certifications.
- Lifetime validity of certifications.
- Unlimited access to e-learning resources.
- Free practice tests for exam preparation.
- Recognition as a ‘Vskills Certified’ professional on Monsterindia.com and Shine.com.
Achieve your career goals with Vskills and stand out in the job market!
Course Outline
The Certification covers the following topics –
1. Course Introduction
2. Using Excel Spreadsheets for Data Analysis
- Viewing and Entering Data
- Formatting and Data Types in Excel
- Excel Formula Basics
- Exploring Excel Functions
- Referencing Data in Formulas
3. Cleaning and Managing Data
- Introduction to Data Quality
- Importing File Data
- Removing Duplicate Data
- Identifying Data Attributes
- Cleaning Data
4. Analyzing Data
- Sort and Filter Data
- Concatenation and SUMIF
- Tackling Complicated “OR” Criteria
- Summarizing Data Using Pivot Tables
- Creating a Pivot Chart
- Working with Excel Charts
- Analyzing Financial Data
- Waterfall Charts
- Conditional Formatting
- Using Database Functions
- Evading Formula Errors

5. What-If Analysis and Analysis ToolPak
- Scenario Manager in What-If Analysis
- Data Tables in What-If Analysis
- Goal Seek in What-If Analysis
- Loading the Analysis ToolPak
- Correlation and Covariance in Analysis ToolPak
- Descriptive Statistics, Moving Average, and Exponential Smoothing
- Additional Analytical and Statistical Applications
Preparation Guide for Certificate in Data Analytics Using Excel
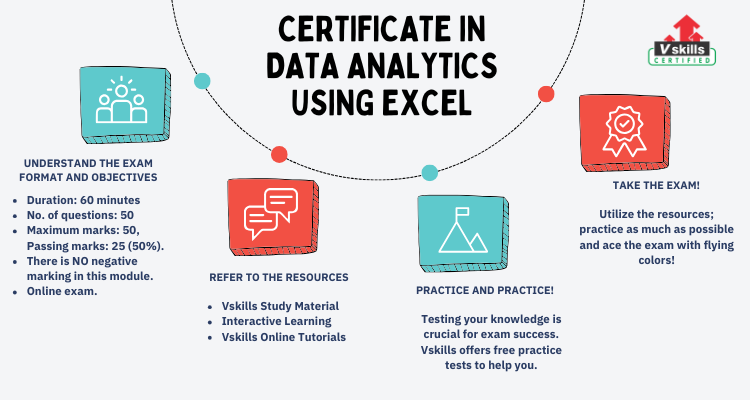
Preparing for the Certificate in Data Analytics Using Excel requires a strategic approach to mastering Excel’s features and understanding the application of data analytics techniques. Here’s a step-by-step guide to help you succeed:
1. Understand the Exam Objectives
- Familiarize yourself with the exam syllabus, which typically includes:
- Data cleaning and preparation.
- Statistical functions and formulas.
- Pivot tables and charts for analysis.
- Data visualization techniques.
- Advanced Excel tools like Power Query and Macros.
2. Study Resources
- Vskills Tutorials: Leverage the comprehensive study materials and tutorials provided by Vskills. These resources are tailored to the exam syllabus and cover key concepts with practical examples.
- Excel Practice: Dedicate time to hands-on practice with Excel. Experiment with datasets to apply techniques like filtering, sorting, and using advanced formulas.
- Supplementary Learning: Explore online tutorials and videos on Excel features like conditional formatting, pivot tables, and advanced charting.
3. Practice Tests
- Vskills Practice Exams: Take advantage of the practice tests offered by Vskills. These mock exams replicate the actual test environment, helping you identify weak areas and improve your time management.
- Sample Questions: Solve sample questions regularly to reinforce your understanding and increase confidence.
4. Master Key Skills
- Data Manipulation: Practice cleaning and organizing raw datasets for analysis.
- Analysis Techniques: Learn to apply Excel’s statistical and analytical tools to derive insights.
- Visualization: Focus on creating effective charts, graphs, and dashboards to communicate data stories.
- Automation: Understand basic automation using Macros to enhance efficiency.
5. Create a Study Plan
- Allocate daily or weekly study time to cover the syllabus systematically.
- Break down topics into manageable sections and review regularly.
6. Practical Application
- Work on real-life datasets or case studies to apply the concepts you learn.
- Use Excel to solve sample business problems, such as sales analysis or financial forecasting.
7. Join Discussion Forums
- Engage with fellow learners and professionals in forums or social media groups.
- Share knowledge, ask questions, and learn from others’ experiences.
Key Tips for Exam Success:
- Review the tutorials thoroughly to ensure complete syllabus coverage.
- Take multiple practice exams to get familiar with the test format.
- Focus on Excel’s analytical and visualization tools, which are often the certification’s core.
- Stay consistent with your study schedule and practice regularly.
By utilizing Vskills tutorials, practice exams, and consistent hands-on practice, you’ll be well-prepared to ace the Certificate in Data Analytics Using Excel and apply your knowledge confidently in professional scenarios.


