Moving Average
Among the most popular technical indicators, moving averages are used to gauge the direction of the current trend. Every type of moving average (commonly written in this tutorial as MA) is a mathematical result that is calculated by averaging a number of past data points. Once determined, the resulting average is then plotted onto a chart in order to allow traders to look at smoothed data rather than focusing on the day-to-day price fluctuations that are inherent in all financial markets.
The simplest form of a moving average, appropriately known as a simple moving average (SMA), is calculated by taking the arithmetic mean of a given set of values. For example, to calculate a basic 10-day moving average you would add up the closing prices from the past 10 days and then divide the result by 10. In Figure 1, the sum of the prices for the past 10 days (110) is divided by the number of days (10) to arrive at the 10-day average. If a trader wishes to see a 50-day average instead, the same type of calculation would be made, but it would include the prices over the past 50 days. The resulting average below (11) takes into account the past 10 data points in order to give traders an idea of how an asset is priced relative to the past 10 days.
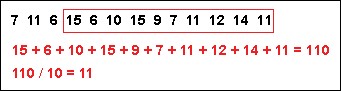
Figure 1
Perhaps you’re wondering why technical traders call this tool a “moving” average and not just a regular mean? The answer is that as new values become available, the oldest data points must be dropped from the set and new data points must come in to replace them. Thus, the data set is constantly “moving” to account for new data as it becomes available. This method of calculation ensures that only the current information is being accounted for. In Figure 2, once the new value of 5 is added to the set, the red box (representing the past 10 data points) moves to the right and the last value of 15 is dropped from the calculation. Because the relatively small value of 5 replaces the high value of 15, you would expect to see the average of the data set decrease, which it does, in this case from 11 to 10.
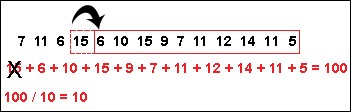
Figure 2
Once the values of the MA have been calculated, they are plotted onto a chart and then connected to create a moving average line. These curving lines are common on the charts of technical traders, but how they are used can vary drastically (more on this later). As you can see in Figure 3, it is possible to add more than one moving average to any chart by adjusting the number of time periods used in the calculation. These curving lines may seem distracting or confusing at first, but you’ll grow accustomed to them as time goes on. The red line is simply the average price over the past 50 days, while the blue line is the average price over the past 100 days.
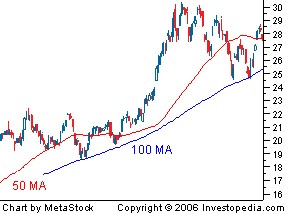
Figure 3
Exponential Method
The exponential moving average is a type of moving average that gives more weight to recent prices in an attempt to make it more responsive to new information. Learning the somewhat complicated equation for calculating an EMA may be unnecessary for many traders, since nearly all charting packages do the calculations for you. However, for you math geeks out there, here is the EMA equation:
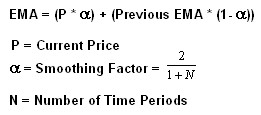
Figure 4
When using the formula to calculate the first point of the EMA, you may notice that there is no value available to use as the previous EMA. This small problem can be solved by starting the calculation with a simple moving average and continuing on with the above formula from there. We have provided you with a sample spreadsheet that includes real-life examples of how to calculate both a simple moving average and an exponential moving average.
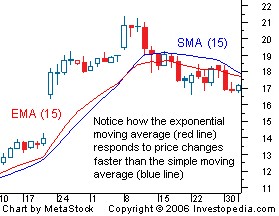
Now that you have a better understanding of how the SMA and the EMA are calculated, let’s take a look at how these averages differ. By looking at the calculation of the EMA, you will notice that more emphasis is placed on the recent data points, making it a type of weighted average. In Figure 5, the numbers of time periods used in each average is identical (15), but the EMA responds more quickly to the changing prices. Notice how the EMA has a higher value when the price is rising, and falls faster than the SMA when the price is declining. This responsiveness is the main reason why many traders prefer to use the EMA over the SMA.