Maintenance Strategies
Maintenance is a risk management practice used to maximise production and minimise loss and waste. Selecting a successful maintenance strategy requires a good knowledge of equipment failure behaviour and maintenance management practices. Once you appreciate why equipment fails, how equipment fails and when equipment fails you can select the right mix of maintenance strategies to extend and maximise its service and performance.
Types of Maintenance Strategies
Run to Failure (Breakdown maintenance) – An acceptable strategy for equipment that is of minimal importance to operations (rarely used or duplicates the function of some other equipment) or has low cost. Take, for example, a $1000 belt feeder, whose lifetime value can be extended by 10% by servicing it every 3 months. How hard are you willing to work to save $100? For a non-critical piece of machinery, the answer should be “not hard.” Equipment designated as Run to Failure are fixed in the event of a breakdown(by repair, restoration or parts replacement) until it is more feasible to simply order a replacement equipment.
Preventive (Scheduled) Maintenance – This strategy is employed by most companies and almost all small to mid sized companies make exclusive use of it. It consists of assets being taken offline, inspected at periodic, predetermined intervals and repaired if necessary. Although it’s a relatively easy strategy to set up and execute, it can prove quite costly in the long run as a majority of the time these inspections are a straightforward pass. It’s recommended that serious attention be given to the efficiency of these schedules. Annual review of a schedule’s effectiveness in raising Overall Equipment Effectiveness by preventing breakdowns and see if the schedule can be lengthened or swapped out for PdM is ideal.
Predictive Maintenance (PdM) – PdM is a condition-based approach to asset management. Typically, monitoring equipment is linked to a CMMS, and generates work orders based on some meter reading (PSI, vibration analysis, widgets/hour) gathered by the monitoring device. It may also be simpler than this, such as visual inspection by operators on the quality or speed at which the equipment is performing. Eg. Conveyor drops below 1000 widgets per hour, trigger an inspection work order. The advantage of PdM (over PM) is the potential for cost savings from reduced man-hours spent on maintenance, and more insight as to the performance and potential issues arising with the machine. ie: Vibration analysis + visual inspection gives more insight than visual inspection alone.
Reliability Centered Maintenance (RCM) – Emerging from the realization that equipment failure probability is not linear , RCM is an in-depth, highly involved process that seeks to analyze all the possible failure modes for each piece of equipment, and customize a maintenance strategy for each individual machine.
The general consensus is that RCM is too sophisticated a technique to be of much practical use. RCM is therefore reserved for an elite class of organizations that have already mastered the basics – maintenance prevention, basic inspections and predictive maintenance. Information needed to choose a maintenance strategy usually includes
- The failure distribution of the unit
- The cost associated with the failure of the unit
- Any safety issues associated with the failure
- The cost of the replacement unit
- The cost associated with scheduled replacements
- The cost of inspection or test
Maintainability Apportionment
Various methods of apportioning, sometimes also called allocating of system reliability and maintainability (R&M) apply to the sub-system and assembly levels in order to establish realistic R&M design requirements at these levels.
The reliability engineer assigns numerical R&M requirements to the various items comprising the system. The apportioned reliabilities should be expressed as either probabilities of survival or as failure rates, depending on the nature of the items. The apportioned maintainability should be expressed as an arithmetic Mean Active Re pair Time (MART), where active repair time is the time taken for defect diagnosis, rectification, and retest; assuming that everything required is immediately available. Maintenance man-hours per operating hour may also be apportioned.
The apportionment of R&M is essential, as it
- Provides the designers and manufacturers of each part of the system with R&M requirements.
- Provides R&M figures for comparison with assessments made during design and development.
- Enables trade-offs to be studied at an early stage.
Factors influencing the apportionments are
- The system configuration and whether it consists of series dependent items only or whether redundancies are included.
- The environments which will be experienced during the duty cycle or operational scenario defined in the Staff Requirements.
- The relative operating times of the items of the system, especially if these do not all operate continuously throughout the mission.
- The criticality of the items of the system, and the development risks.
- Whether the items are repairable during the mission.
- The size, weight, accessibility of items for repair and the availability of Built-In-Test (BIT)
Process
The first step in the apportionment process is to produce models which relate the R&M of the complete system to those of the individual items comprising the system. The reliability block diagram (RBD) is a good means to achieve this. The next step is to determine the reliability of each item in the models in terms of a failure rate or probability and the associated maintain ability in terms of a MART. It may be convenient with some systems to express reliability as the product of two probabilities
- The probability that an item is failure free at the start of the mission.
- The probability that an item survives the mission given that it was failure free at the start.
There are two main types of system operation and the differences influence the manner in which the reliability is calculated for each. These are:
- Systems which run continuously, during part or all of the mission and, through monitoring, any failures are detected and repair action initiated as they occur or when convenient.
- Systems which can be considered to operate instantaneously on demand.
In apportioning system R&M, the consequences of system software should be taken into account and allowances should be made for the contribution software may make to system failures. Reliability cannot be apportioned to software in the same way as to hardware because failures due to software do not occur as a direct result of the passage of time. Also, there are no standard methods for the prediction of system reliability due to software faults so comparisons cannot be made with predicted values. It is possible to develop systems containing software in which soft ware faults manifest themselves as failures which have only a minor effect on system availability such that the software effects can be ignored (i.e. there is no repair or replacement involved). However, it should be noted that this is not always the case and recovery from system failures due to software faults may take a significant time and maintenance effort, contributing to system unavailability. Consequently, the R&M aspects of software cannot be ignored in the apportionment process.
The next step in the apportionment process is to calculate the system R&M from the associated models and the apportionments given to the individual items.
Derivation of Reliability Values – When a system consists of items whose duty cycles are not all the same then this should be taken into account in the apportionment. For example, if a system operates a 10 hour mission, but one item within the system only operates for one hour per mission, then the time value used in calculating its apportioned reliability would be one hour.
Other aspects of utilization, such as power switching cycles for electrical or electronic items, and environmental conditions should also be taken into account, especially when equipments in the system are subject to differing utilization conditions.
When a system or an item within a system operates prior to the time a mission starts, or where multiple missions are involved, it may be necessary to consider the probability of the item being available at the start of each mission.
Derivation of Maintainability Values – The maintenance flow diagrams evolved during a maintainability analysis are annotated with the estimated times to perform each activity. There may be insufficient design data at this stage to reach accurate estimates; in such cases values will have to be assigned on the basis of previous experience and/or engineering judgment. When a complete set of times has been assigned it will be possible to:
- Deduce mean active corrective/preventative maintenance times by making use of the reliability figures allocated to the sub-systems and lower assemblies.
- Ascertain that the overall system requirements can be met for the depth of maintenance required at each line.
- Deduce the corresponding sub-system requirements which are consistent with the system requirements.
Types of Apportionment
- Equal Apportionment: based on the assumption that each subassembly has an exponential failure distribution, this in one of the most simple of the apportionment methods in that each subassembly is afforded equal apportionment.
- AGREE Apportionment: This method of apportionment takes into account the complexity and the significance of each subassembly and assumes that subassemblies are in series and have exponential failure distribution. Developed by Advisory Group on Reliability of Electronic Equipment it is based on the minimum acceptable mean life required for each subassembly to satisfy the minimum acceptable mean life of the whole system.
- Growth Apportionment: the principle underpinning this method is to apportion reliability growth to the subassemblies/subsystems in order to achieve the required reliability at least cost. In the early stages frequently it will be employed to support design effort and determine the reliability growth requirement to support the whole system. In the latter stages it will be employed to optimize get well programmes to address system reliability shortfall.
- Repairable System Apportionment: assumes that each subassembly has a constant failure rate and are in series with an exponential failure distribution. Each subassembly is allocated a failure rate which allows the host system an achieve its required availability requirement for a repairable system.
- Feasibility Apportionment: is base on the reliability (or maintainability) drivers such as environment, operating duration, mission profile, system complexity, etc. which have a direct influence on reliability attainment. It assumes that sub-assemblies are in series and have an exponential failure distribution and each driver is rated/factor ed based on previous knowledge and/or judgement to provide weigh ting and subsequently allocations for each subassembly.
- ARINC Apportionment: assumes that each subassembly has an exponential failure distribution and are all in series. Designed by the Advisory Group on Reliability of Electronic Equipment allocations are based upon previous data, experience and weighting factors.
A system-level maintainability requirement may need to be allocated to lower levels of the system. Maintainability allocation is a continuing process of apportioning requirements at the system level to subsystem levels and is similar to a system reliability requirement being allocated to the various subsystems. To allocate the maintainability requirements, the failure rate and the MTTR are used.
MTTR Allocation
A series system has three subsystems.
The failure rate for subsystem i is λ l , and the MTTR for subsystem i is ti.
The system failure rate is λ. = λ1 + λ2 + λ3
The system-level MTTR requirement is t*
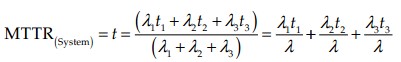
The MTTR allocation to subsystem i is

