Reliability prediction is a design tool and does not measure the reliability of the product. It shows the relative reliabilities so as to have requisite allocations. Whatever the accuracy of the exercise, if one module is shown to have double the MTBF of another then, when calculating values for modules in order to achieve the desired system MTBF, the values allocated to the modules should be in the same ratio. Prediction also permits a reliability comparison between different design solutions. Again, the comparison is likely to be more accurate than the absolute values. The accuracy of the actual predicted value will depend on
- Relevance of the failure rate data and the chosen environmental multiplication factors.
- Accuracy of the mathematical model.
- The absence of gross over-stressing in operation.
- Tolerance of the design to component parametric drift.
The greater the number of different component types involved, the more likely that individual over- and under-estimates will cancel each other out. Quantified reliability prediction usually applies to random hardware failures only. Systematic failures being device specific, are not quantified by failure rates and do not repeat themselves once they have been designed out.
Need
Reliability predictions are very important to the management of a product life cycle. These predictions are necessary for many reasons, such as:
- Help assess the effect of product reliability on the maintenance activity and on the quantity of spare units required for acceptable field performance of any particular system. Reliability prediction can be used to establish the number of spares needed and predict the frequency of expected unit level maintenance.
- Provide necessary input to system-level reliability models. System-level reliability models can be used to predict frequency of system outages in steady-state, frequency of system outages during early life, expected downtime per year, and system availability.
- Provide necessary input to unit and system-level life cycle cost analyses. Life cycle cost studies determine the cost of a product over its entire life. This includes how often units and systems fail during the first year of operation as well as in later years, helping to establish total life cycle cost estimates.
- Assist in deciding which product to purchase from a list of competing products. As a result, it is essential that reliability predictions be based on a common procedure. Given that everything else is equal, reliability predictions can be a deciding factor.
- Can be used to set factory test standards for products requiring a reliability test. Reliability predictions help determine how often the system should fail, making it possible to determine if adequate testing is being performed.
- Are needed as input to the analysis of complex systems such as weapon systems and complex control systems. It is necessary to know how often different parts of the system are going to fail even for redundant components.
- Can be used in design trade-off studies. For example, a supplier could look at a design with many simple devices and compare it to a design with fewer devices that are newer but more complex. The unit with fewer devices is usually more reliable.
- Can be used to set achievable in-service performance standards against which to judge actual performance and stimulate action. Feedback can then be used to adjust testing procedures.
Repairable and Non-repairable Devices – If testing results are available, reliability predictions can be made based on the distribution of times to failure and the estimated parameters. If the exponential distribution models the times to failure, the estimated parameter is the mean. This is called the mean time to failure (q ) or MTTF. If n units are tested and during the test r units fail, the estimate of MTTF is

where
- T is the total time accumulated on the units including the units that failed and the units that did not fail
- r is the number of failures
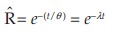
The estimated failure rate![]() is the reciprocal of the mean. The estimated reliability for a mission time of t is
is the reciprocal of the mean. The estimated reliability for a mission time of t is
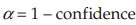
A lower confidence limit ![]() can be calculated for the estimate of the mean, as
can be calculated for the estimate of the mean, as
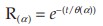
The estimate of reliability for a mission time t at a confidence level of 1 – ![]() is
is
Predicting reliability for a repairable system becomes complicated because the system can be restored to use after a failure. After a repair, components have different operating times and hence, the system cannot be modeled using a constant failure rate. Thus, in such cases, predictions should be made as to the number of spare parts needed in order for the system to meet specified availability requirements.
