Project Management refers to the process of getting the project completion within the available resources and designated timeframe effectively and efficiently. It includes various crucial entities which are
Project Charter and Plan – Project charter is a statement of objectives of a project which also sets out detailed project goals, roles and responsibilities. It also identifies the main stakeholders. Project charter henceforth consists of the problem statement for which the project is initiated, the purpose outlining the goals to be achieved by the project, the scope of the project on enlisting the resource requirement and the results to achieve in quantifiable terms. Project charter also contains the likely benefits to the stakeholders for taking up the project and justifies the feasibility for same.
Project plan development involves setting up timelines and milestones to achieve as the project processes. It acts as the basis on which resource requirements are computed. Various project planning tools are used for the purpose like Gantt charts, CPM/PERT charts, project schedules, etc.
Project Risk Analysis is conducted during project planning to work out feasibility of the project as well develop counter-measures to mitigate risks involved and their impact. Usually aspects of project which are analyzed are safety, reliability, serviceability, etc. Risk analysis involves identification and mitigation of risks. Various analysis tools are used like
- SWOT (Strengths, Weaknesses, Opportunities and Threats) Matrix – It involves a scan of the internal and external environment to classify internal as strengths (S) or weaknesses (W), and those external to the firm can be classified as opportunities (O) or threats (T).
- Risk Priority Number – Risk Priority Number (RPN) is a measure risk by assigning the RPN values range from 1 (absolute best) to 1000 (absolute worst) to identify critical failure modes with project.
- Failure modes and effects analysis (FMEA) – It identifies failures in a project by studying the impact of all possible failures which are prioritized according to severity, frequency and identification.
Risk mitigation involves continuous review of risk identification and mitigation plans as during project progress environmental changes and new risk are identified if any step changes mid way thus, a risk management system is embedded during project planning.
Project Scope – After defining the project charter and planning, the project scope is finalized thus, defining the resource requirement and listing the affected departments during the project execution. Project managers utilize various tools during this step like SIPOC, Pareto charts, brainstorming, etc to defining and documenting the project scope.
Project Metrics – They are the essential component of project management which shows the status of the project. Their selection and updation is necessary for proper monitoring of the project’s progress. Project metrics are tactical and used by project manager to adapt project work flow and technical activities i.e. guide adjustments to work schedule to avoid delays and assess product quality on an ongoing basis. Project metrics usually applied measure consumption of time, budget, other resources and quality of output.
Project Documentation – It involves documenting all objectives, milestones, activities, process and blueprints of the project or in short all documents from project being conceived to implementation so as to provide accurate measure of project success. Large projects need more detailed documentation to cover all aspects of the project. Various graphical tools and techniques are used like state mapping, storyboard and six sigma projects implement DMAIC methodology thus documentation is done accordingly with figures and charts showing activity at that stage.
Project Closure – It is the last phase of project which confirms achievement of laid objectives for the project with completion of required documentation. It also involves discussion with project sponsors for project completion agreement which involves comparison with the project charter.
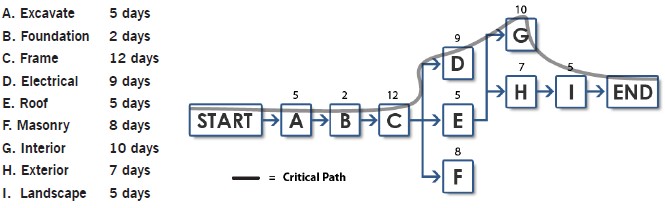
CPM/PERT Chart
CPM or “Critical Path Method” – It is a tool to analyze project and determine duration, based on identification of “critical path” through an activity network. The knowledge of the critical path can permit project managers to change duration. It is a project modeling technique developed in 1950s and is used with all forms of projects. It displays activities as nodes or circles with known activity times.
CPM is a diagram showing every step of the project, as letters with lines to each letter representing the sequence in which the project steps take place. A list of activities is required to complete the project and the time (duration) that each activity will take to complete, along with the sequence and dependencies between activities. CPM lays out the longest path of planned activities to the end of the project as well as the earliest and latest that each activity can start and finish without delaying other steps in the project. The project manager can then, determine which activities in the project need to be completed before others and how long those activities can take before they delay other parts of the project. They also get to know which set of activities is likely to take the longest, also called as the critical path which is also the shortest possible time period in which the project can be completed.
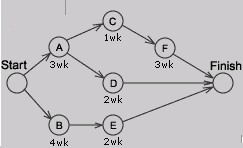
PERT Chart – A PERT chart (program evaluation review technique) is a form of diagram for CPM that shows activity on an arrow diagram. PERT charts are more simplistic than CPM charts because they simply show the timing of each step of the project and the sequence of the activities. In PERT, estimates are uncertain and ranges of duration and the probability that activity duration will fall into that range is taken whereas CPM is deterministic.
A PERT chart is a graphic representation of a project’s schedule, showing the sequence of tasks, which tasks can be performed simultaneously, and the critical path of tasks that must be completed on time in order for the project to meet its completion deadline. The chart can be constructed with a variety of attributes, such as earliest and latest start dates for each task, earliest and latest finish dates for each task, and slack time between tasks. A PERT chart can document an entire project or a key phase of a project. The chart allows a team to avoid unrealistic timetables and schedule expectations, to help identify and shorten tasks that are bottlenecks, and to focus attention on most critical tasks. It is most useful for planning and tracking entire projects or for scheduling and tracking the implementation phase of a planning or improvement effort.
Developing PERT Chart
- Identify all tasks or project components – Ensure the team has knowledge of the project so that during the brainstorming session all component tasks needed to complete the project are captured. Document the tasks on small note cards.
- Identify the first task that must be completed – Place the appropriate card at the extreme left of the working surface.
- Identify any other tasks that can be started simultaneously with task #1 – Align these tasks either above or below task #1 on the working surface.
- Identify the next task that must be completed – Select a task that must wait to begin until task #1(or a task that starts simultaneously with task #1) is completed. Place the appropriate card to the right of the card showing the preceding task.
- Identify any other tasks that can be started simultaneously with task #2 – Align these tasks either above or below task #2 on the working surface.
- Continue this process until all component tasks are sequenced.
- Identify task durations – Reach a consensus on the most likely amount of time each task will require for completion. Duration time is usually considered to be elapsed time for the task, rather than actual number of hours/days spent doing the work. Document this duration time on the appropriate task cards.
- Construct the PERT chart – Number each task, draw connecting arrows, and add task characteristics such as duration, anticipated start date, and anticipated end date.
- Determine critical path – The project’s critical path includes those tasks that must start or finish on time to avoid delays to the total project. Critical paths are typically displayed in red.
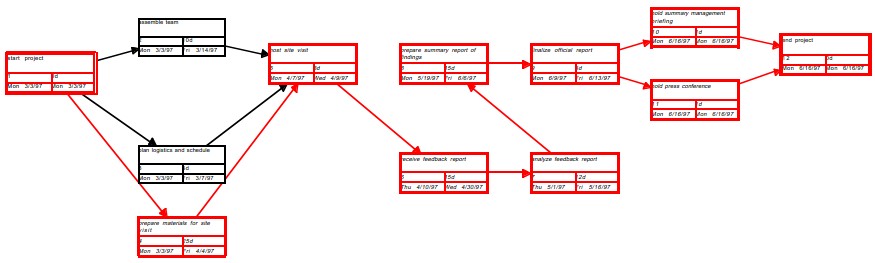
Activity Network Diagram
It charts the flow of activity between separate tasks and graphically displays interdependent relationships between groups, steps, and tasks as they all impact a project. Bubbles, boxes, and arrows are used to depict these activities and the links between them. It shows the sequential relationships of activities using arrows and nodes to identify a project’s critical path. It is similar to the CPM/ PERT and also called as arrow diagram.
Developing Activity Network Diagram – Development starts with compiling a list of tasks essential for completion of the project. These tasks are then arranged in a chronological order, depending on the project considering inter-task dependency. All tasks are placed in a progressing line with tasks that can be done simultaneously, is placed on parallel paths, whereas jobs that are dependent should be placed in a chronological line. Apply realistic estimate to each task then, enlist the critical path.