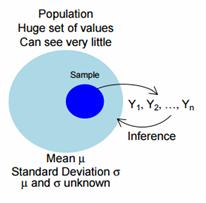
A population is identified with the goal of estimating the (unknown) population mean value, identified by µ. You select a random or representative sample from the population where, for notational convenience, the sample measurements are identified as Y1, Y2, …, Yn, where n is the sample size.

Given the data, the best estimate, of µ is the sample mean

There are two main methods for inferences on µ: confidence intervals (CI) and hypothesis tests. The standard CI and test procedures are based on Y and s, the sample standard deviation.
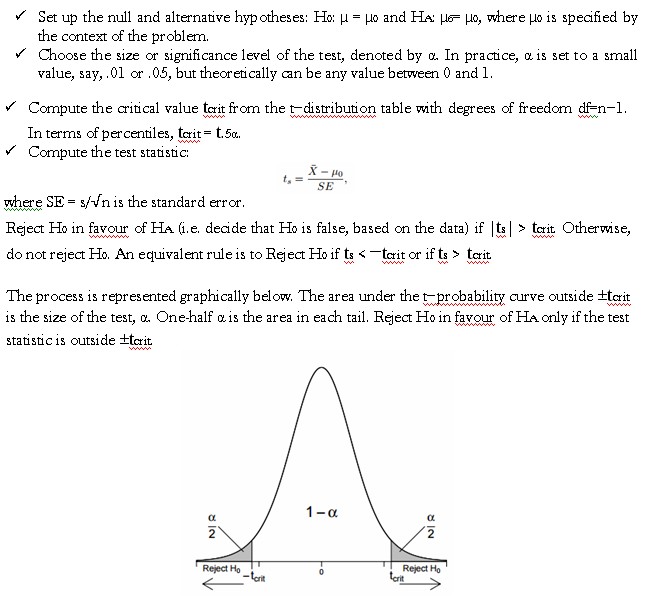
Hypothesis Test for µ Suppose you are interested in checking whether the population mean µ is equal to some pre-specified value, say µ0. This question can be formulated as a two-sided hypothesis test, where you are trying to decide which of two contradictory claims or hypotheses about µ is more reasonable given the observed data. The null hypothesis, or the hypothesis under test, is H0: µ = µ0, whereas the alternative hypothesis is HA: µ6= µ0. At this point, the focus is on the mechanics behind the test. The steps in carrying out the test are

Example
A consumer group, concerned about the mean fat content of a certain grade of burger submits to an independent laboratory a random sample of 12 burgers for analysis. The percentage of fat in each of the burgers is as follows.
21 18 19 16 18 24 22 19 24 14 18 15
The manufacturer claims that the mean fat content of this grade of burger is less than 20%. Assuming percentage fat content to be normally distributed with a standard deviation of 3, carry out an appropriate hypothesis test in order to advise the consumer group as to the validity of the manufacturer’s claim.
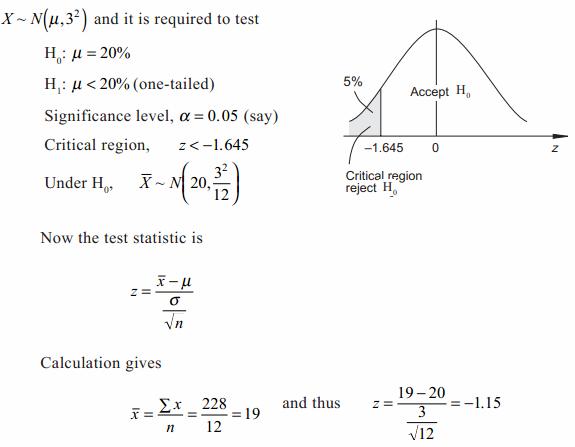
For this problem, denoting the percentage fat content by X , then

This value does not lie in the critical region. Thus there is no evidence, at the 5% level of significance, to support the manufacturer’s claim.

