The nature of retail has changed dramatically over the past few years, and with it, so have the expectations of the consumer. Modern customers look at more than just products when they shop with retailers, they also value companies that identify their individual needs and meet their increasing expectations. To achieve this, retailers must first do away with the one-size-fits-all approach when interacting with customers and adopt a more personalized strategy.
This is where retail customer segmentation comes in.
Simply put, customer segmentation is when retailers arrange their broad customer base into smaller subgroups – often with the help of a next-generation POS system. Retailers pick and choose relevant groups and add them to their POS database, which continuously updates itself as shoppers make purchases or interact with that store’s shopkeepers and customer service professionals.
Customer segmentation makes marketing, product development, and even customer service more effective by helping retailers gain further insight into specific groupings within their customer base. Remember that not every shopper has the same expectations from a company. Without customer segmentation, businesses often struggle to meet these expectations when its customers are grouped into a collective, rather than sorted into segments that reflect them more accurately.
Another benefit of segmentation is that it helps retailers get a better understanding of their performance. Metrics relating to sales, marketing campaigns, and incentive programs can all be broken down into segments based on the customer’s transactional data. Even better, most cloud-based POS solutions automatically record and update a customer’s transaction data every time they make a purchase, and then sync that information across all retail locations and connected devices.
Customer Group
A customer group is a subset of similar customers. When businesses begin retail customer segmentation, individuals are sorted into groups based on gender, geographical location, commonly purchased goods, or other defining features. If you’re wondering how to start segmenting customers, begin by identifying broad categories that apply to large groups of shoppers. Once you’ve established overarching groups, you can break those down into smaller, more specific categories. It’s okay if your customer groups see overlap, but too much overlap can hinder your data analysis.
Retail marketers are constantly looking for ways to improve the effectiveness of their campaigns. One way to do this is to target customers with the particular offers most likely to attract them back to the store and to spend more on their next visit. In other words, the marketer’s goal is to make the most relevant match between customer and offer.
Customer Segmentation Using Cluster Analysis
In brief, cluster analysis uses a mathematical model to discover groups of similar customers based on finding the smallest variations among customers within each group. The process is not based on any predetermined thresholds or rules (as are most simple segmentation methods), but rather the data itself generates the customer prototypes that inherently exist within the population of customers.
The two main advantages of cluster analysis over simple threshold/rule-based segmentation are (1) practicality – it would be practically impossible to use predetermined rules to segment customers over many dimensions, and (2) homogeneity – variances within each resulting group are very small in cluster analysis, whereas rule-based segmentation typically groups customers who are actually very different from one another.
Performing Cluster Analysis
The first step in cluster analysis is to prepare the customer spend data for each product category. Grocery stores and supermarkets would typically look at categories such as packaged foods, meat, dairy, produce, seafood and bakery. More granular category levels can also be selected if the goal is to segment customers within a particular known group. For example, the supermarket could try to market specialty cheeses to cheese lovers by segmenting customers based on their purchases of various categories of cheese (e.g., Cheddar, Cottage, Monterrey Jack, Mozzarella, Swiss).
The next step is to perform cluster analysis on all customers to identify distinct homogeneous groups of customers with minimal variance between their purchasing behaviors. This identifies unique “customer prototypes” (such as meat lovers, produce lovers and gourmet lovers) to which specific marketing offers can be targeted.
(It is important to mention that part of the cluster analysis process is normalizing price levels across departments using weights related to the average basket price in each department. This prevents the inherent differences in the absolute prices between departments from skewing the analysis.)
The following chart shows partial results of a cluster analysis performed by a chain of grocery stores:
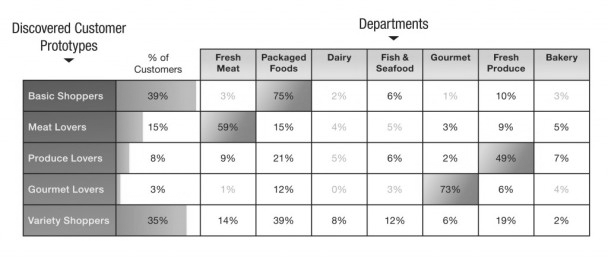
This chart shows a seven-dimension cluster analysis which resulted in the discovery of five customer prototypes: basic shoppers (who purchase a variety of products, but mostly packaged items), meat lovers (who purchase a large amount of meat), produce lovers (who purchase a large amount of fresh produce), gourmet lovers (who purchase mostly items from the gourmet department) and variety shoppers (whose shopping behavior is widely spread among departments).
Cluster analysis, usually based on the k-means algorithm, is not something new. Many statistical software packages provide the means to perform cluster analysis and there are even Excel add-ins available for the purpose.
Other Analysis Tools
- Retail Advanced Clustering – Evaluate sales performance, customer penetration, and market share across stores, geographies and markets to plan and compete in an evolving landscape of pure play, general merchants, and traditional competitors.
- Retail Attribute Extraction – Remove data quality issues from the equation with machine-learning to enable attribute extraction.
- Retail Affinity Analysis – Gain actionable insight into your shoppers’ behavior across channels and maximize the potential of your data through persona-based workflows and dashboards. Affinity analysis identifies similarities, halo, and cannibalization effects, and shows how store clusters perform relative to each other.
- Retail Customer Decision Tree – Create customer segment-specific decision trees using available transaction level data and understand the incremental value of all items with an unbiased view of manufacturers.
Essential Segmentation Variables
- Acquisition Path: How a customer ended up on your site to make the first purchase says a good deal about how he or she is likely to shop over time. Do some digging on your own as the implications fluctuate from retailer to retailer. Example: A retailer could cut spending on Facebook after discovering that subscribers acquired through that channel converted to paying customers at a much lower rate than those acquired elsewhere.
- First Purchase: A shopper’s first purchase says a lot about what type of customer he or she is likely to become. Brand, category and sub-category can give you strong conclusions on things like price sensitivity, shopping persona, and level of attachment to your store. Example: A fashion retailer could change its retention marketing program after learning that customers whose first purchase was a sweater were over three times more likely to repeat in their first 90 days than customers who started by buying in other categories.
- Device Type: For many retailers, shoppers who come in on certain device types are inherently different from those who arrive through the more conventional desktop route. Example: A daily deal site might discover that its iPhone customers are worth twice as much as desktop customers – and change the way it targets and communicate with these customers accordingly.
- Geography: Geography gives a surprising amount of valuable info on your customers. Beyond the low-hanging fruit (e.g., cities like New York and San Francisco tend to be both wealthier and more fashion-forward), geography can also give insight into the density of brick-and-mortar shopping options as well as regional shopping preferences. Example: An apparel retailer might discover that its Midwestern customers are worth far more than average because they tend to buy pricey knits and outerwear during the cold winter months – so its acquisition marketing team could begin targeting new customers from the region.
- Income: Product preferences and even repeat rate can vary widely with disposable income. Tip on finding this info: Many data providers will provide you with their best guess on an individual’s income or assets by looking at median income or median home price in particular ZIP+4’s. Example: A retailer could use a customer’s predicted income level to determine the right items to show him or her in emails.
- Gender: Gender can say a lot about a shopper’s predicted spend. For example, a lifestyle retailer may be surprised to discover that although its target demographic is male, its female customers are actually more valuable. Example: This luxury retailer’s marketing team could use this insight to transform the messaging and creative of their display advertisements.
- Age: The relationship between age and lifetime value tends to vary from retailer to retailer, but is almost always a source of insight for lifetime value segmentation. Some retailers may find that their younger customers skew more valuable because of a greater level of comfort with e-commerce transactions. Other retailers may find that older customers tend to be more affluent, more brand-loyal, and less prone to price comparison. Example: A fashion retailer could start targeting an older demographic after discovering that its older customers tend to be more affluent, more brand-loyal, and less prone to comparison shopping.
