Spreadsheet packages are good at numerical manipulation and have a wide range of financial and mathematical functions. It is easy to present calculations in a readable form and to mix text and graphical display. Spreadsheets are enormously popular, widely available and easy to use.
The flexibility of spreadsheets makes it possible to use them to tackle problems that would be more appropriately modeled with different software. Their availability and ease of use makes this an extremely common mistake. Before one can design a spreadsheet, he/she needs to make sure that a spreadsheet is the most appropriate tool for the job.
Excel has a wide range of add-in functions that allows a lot of specific calculations. Many of these can be very useful, but if it is found that many are used, it may suggest specialist packages. For example, if a person is using a lot of the database functions, he probably should be using database software.
The table below compares the strengths and weaknesses of a number of different analysis packages.
| Software Type | Strengths | Weaknesses |
| Spreadsheets e.g.: Microsoft Excel, Lotus 123 | numeric manipulation; financial functions; user interface; graphical reports; easy to learn; and time series modeling. | handling large quantities of data; multi-dimensional data; systems with feedback or circularity; looping and branching; and can develop “black box” systems. |
| Databases e.g.: Microsoft Access | handling large volumes of data; user interface; can develop “black box” systems; and Multi-dimensional data. | complex calculations; complex report structures; graphical reports; and time series modeling. |
| Statistical software e.g.: SAS | handling large volumes of data; and Complex statistical functions. | expensive; and More difficult to learn. |
| Multi-dimensional packages e.g.: Oracle Financial Analyser | multi-dimensional data; handling large volumes of data; “slice and dice” reporting; and Aggregation of data. | specialised use; more difficult to learn; expensive; and used more for information reporting than modeling. |
| System Dynamics packages e.g.: Vensim, Powersim | systems with feedback or circularity; “soft” variables such as staff morale; multi-dimensional data; and graphical representation of the model structure. | producing financial statements; difficult to understand and accept the processes; and specialised skills required to develop and maintain. |
| Rules based packages e.g.: Applications Manager | can develop “black box” systems; and looping and branching. | specialised use; and more difficult to learn. |
MS-EXCEL Window Elements
Microsoft Excel is a Spreadsheet package that is widely used for data analysis purpose. The workspace called the workbook is divided into a number of sheets called the worksheet. The screen that appears on opening MS-EXCEL is-
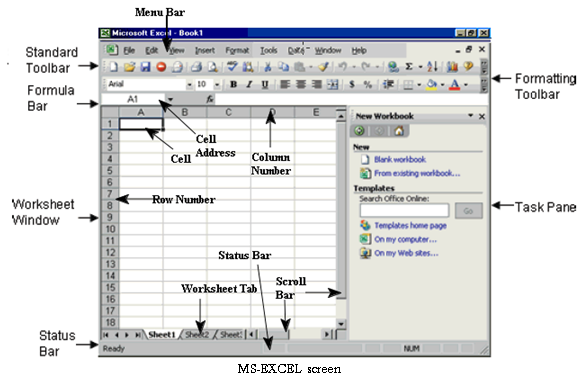
Various elements are
- Menu Bar – It is below the title bar of the window, listing all drop down menu of MS-Excel It has nine drop down menus.
- Status Bar – It is placed at the bottom of the window display status of keyboard lock keys (Num, scroll, Caps) and other computed result
- Row and Row Number – The horizontal lines are called the rows these are numbered 1,2,3 and so on up to 65536.
- Column and Column Number – The vertical lines are called the columns these named A, B, C and so on up to IV.
- Cell – The intersection of the rows and the columns is called the cell.
- Cell Address – The cell address comprises of the column name and the row address; therefore, the cell address of the very first cell would be A1 i.e. first column and first row. The first cell has “A1” as its address and last cell’s address is IV65536
- Workbooks – In Microsoft Excel, a workbook is the file in which we work and store our data. Because each workbook can contain many sheets, we can organize various kinds of related information in a single file.
- Worksheets – Use worksheet (The primary document that we use in Microsoft Excel to store and work with data. It is also called as a spreadsheet. A worksheet consists of cells that are organized into columns and rows; a worksheet is always stored in a workbook.) to list and analyze data. We can enter and edit data on several worksheets simultaneously and perform calculations based on data from multiple worksheets. When we create a chart, we can place the chart on the worksheet with its related data or on a separate chart sheet. Each worksheet is divided into rows and columns.
- Work Sheet tabs – The names of the sheets appear on tabs at the bottom of the workbook window. To move from sheet to sheet, click the sheet tabs.
