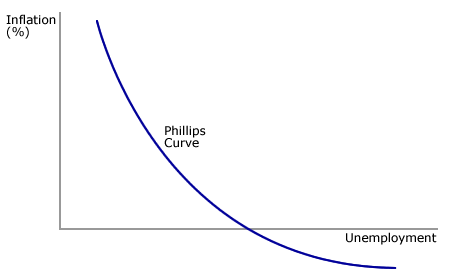
Phillips Curve is an economic concept given by British economist A.W. Phillips. According to this concept, inflation and unemployment have a inverse relationship. Decreased unemployment will lead to more wages paid to labour increase in that economy, which will lead to economic growth. This will result in higher levels of inflation. There is a short run tradeoff between unemployment and inflation, and this has not been observed in the long run. Phillips studied the wage inflation and unemployment rates of the British economy over the period of 1861-1957 and then plotted them on a scatter diagram.
The diagram represents the curve given by A.W. Phillips. The explanation behind the Phillips curve is that if there is a fiscal stimulus in the economy by the government, then there will be a increase in aggregate demand. An increase in aggregate demand will also lead to an increase in the number of labours, therefore, there will be a decrease in the number of unemployed people. Now, the firms will have to compete for fewer workers by raising nominal wages. As a result, the wages will rise. The firms will pass on these rise in wages to the customers by increasing the prices of commodities, which is an increase in inflation.
Usually economists no longer use the Phillips curve because it is considered to be too simple and also it is not applicable in the long term. Now, modified forms of Phillips curve that take inflationary expectations into account are used.
Click here for government certification in Accounting, Banking & Finance


10 Comments. Leave new
Good one!
The Phillips curve is not in use because it is not tight enough for depicting a complicated relationship in a complicated economy. Good efforts!
Informative article
Great job u did..!
thank you for introducing me to Philips Curve so efficiently.
good one,nicely described
Nicely described!!
Informative 😀
nice
great…