
Not long before, when I asked my cousin elder brother, who is an established professional and an avid reader and had roamed almost the entire country – “What place must be the best to live in India if I get to choose ?“, he didn’t hesitate to answer immediately -“That would be Kerala.” I wondered why would he say a place too far south and too unknown in language and culture to people above Tropic of Cancer. The curious mind never stops analyzing and so did I. I began to search on various aspects that would help me justify his opinion.
High Human Development Index (HDI) – 0.790 ; Highest Literacy Rate – 93.9 % ; Highest Life Expectancy – 77 years ; Highest Sex Ratio – 1.084 ; Least Corrupt State of India ; Highest Media Exposure in India ; Lowest Positive Population Growth Rate – 3.44 % ; Lowest Murder Rate ; Highest % of Households with Toilets – 90% ; Highest Biodiversity in India ; among Highest Air Quality and Pollution ; Highest Initiative to Mitigate Environmental Conditions
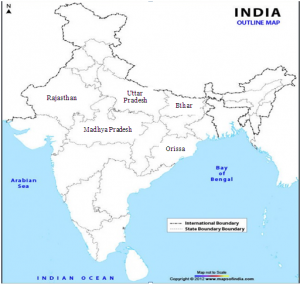
I compare it with Indian states that are collectively called BiMaROU (Bihar (& Jharkhand), Madhya Pradesh, Rajasthan, Orissa, Uttar Pradesh). I didn’t have to make much effort, as in every list this group was found collectively among lower rankings (in positive parameters) and higher rankings (in negative parameters).
| FACTOR | CRITERIA | KERALA | BIHAR | J’KHAND | MP | RAJ | ODISHA | UP | |||||||
| = | # | = | # | = | # | = | # | = | # | = | # | = | # | ||
| HDI | 1.000 – Highest , 0.000 – Lowest | 0.79 | 1 | 0.37 | 21 | 0.38 | 19 | 0.37 | 20 | 0.43 | 17 | 0.36 | 22 | 0.38 | 18 |
| Literacy Rate | % of Literate | 93.9 | 1 | 63.8 | 35 | 63.6 | 32 | 70.6 | 28 | 67.1 | 33 | 73.5 | 25 | 69.7 | 29 |
| Life Expectancy | No. of Years (19 States ) | 77 | 1 | 61.6 | 12 | 58 | 17 | 57.9 | 19 | 62 | 11 | 59.6 | 15 | 60 | 14 |
| Sex Ratio | # Females / Males | 1.08 | 1 | 0.91 | 12 | 0.92 | 11 | 0.93 | 9 | 0.90 | 15 | 0.95 | 4 | 0.87 | 17 |
| Corruption | Composite Corruption Score (20 States ) | 2.4 | 1 | 6.95 | 20 | 5.2 | 14 | 5.84 | 18 | 5.43 | 16 | 4.75 | 9 | 4.91 | 10 |
| Media Exposure | % of People exposed to Media | 99 | 1 | 73 | 25 | 59 | 29 | 70 | 27 | 76 | 23 | 77 | 22 | 78 | 19 |
| Pop. Growth Rate | % increase from previous year | 4.9 | 28 | 25.1 | 3 | 22.3 | 7 | 20.3 | 9 | 21.4 | 8 | 14 | 21 | 20.1 | 10 |
| Murder Rate | # deaths / 1,00,000 | 1.1 | 28 | 3.6 | 8 | 5.3 | 2 | 3.2 | 12 | 2.1 | 24 | 3.8 | 6 | 2.4 | 21 |
| Sanitation | % Houses with Toilets | 93 | 1 | 18 | 25 | 8 | 29 | 13 | 28 | 20 | 24 | 14 | 27 | 22 | 23 |
| Air Pollution | ESI | 0.75 | 3 | -0.38 | 20 | -1.33 | 29 | -0.25 | 18 | -0.45 | 22 | 0.45 | 8 | -1.05 | 27 |
= : Value , # : Rank
HDI : Human Development Index
ESI : Environmental Sustainability Index
This is a clear contrast between the two extremes, on one side, the weak part of Indian economy, that needs most attention and on the other side, an ideal state which has already established the developmental goals for the nation, by portraying itself as an ideal state.


17 Comments. Leave new
Great effort! Informative post!
Great! I like the way you have written the article with all of your research. AMAZING!
Thank you Akanksha. Yes it is a well researched article.
Thanks Akanksha !
amazing job!
Being a Malayali (keralite ) I am proud to here this, but don’t think this is heaven. The state have its own problems too..
BTW if you are coming to kerala, Keralathilekk swagatham (Welcome to Kerala) 🙂
I know it is not a perfect state, but even a silver lining in the cloud can be praised. Kerala has set milestones when it comes to demographic, economical and environmental parameters.
Its good that you have shown comparison with other states too rather than talking of Kerala only…well researched article..good job!
Good effort and informative..!
Good choice of stats Nuruddin. Really, well explained.
very informative.!
Well Written!!!
Well researched and elaborate article
Well written.
Exhaustive information 🙂
very informative 🙂
Informative