Excel is an invaluable source of financial data analysis. Every day, an uncountable amount of financial data is analyzed by financial experts. These data helps investors to improve investment portfolios and dig deeper into the financial market.
What Excel skills are most valuable for finance and accounting?
- Managing Data with Table
- Vlookup
- Index and match
- IF,AND,OR
- Pivot Tables and Power Pivot
- Named Ranges
- Array Formulas
- Custom number formats
- Conditional Formatting
- Special types of paste
- Text-To-Columns
- Building Financial Models
- Solver and Goal Seek
- VBA and Macros
- Data Formatting
- Presenting with Charts
VLOOKUP
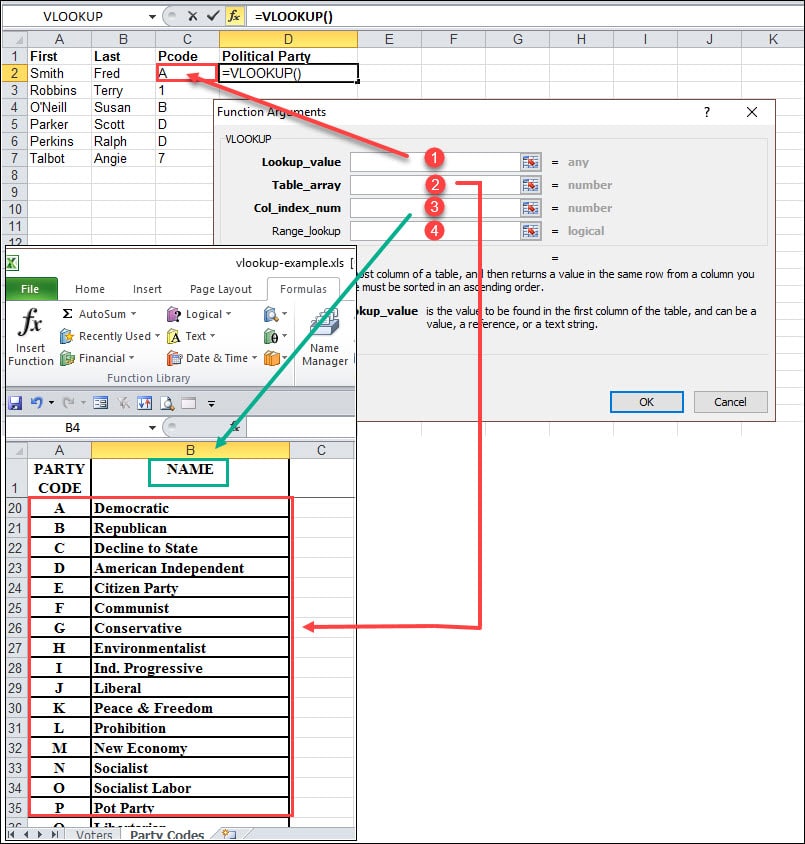
This is most commonly used function in excel. We use this while looking up reference data in more than one fields. The VLOOKUP function performs a vertical lookup by searching for a value in the first column of a table and returning the value in the same row in the index_number position.
The VLOOKUP function is a built-in function in Excel that is categorized as a Lookup/Reference Function. It can be used as a worksheet function (WS) in Excel. As a worksheet function, the VLOOKUP function can be entered as part of a formula in a cell of a worksheet.
Also, learn the related function HLOOKUP.
Reference link: How to use vlookup
Index and Match
These also reference functions similar to VLOOKUP but more powerful and allow you to look up values in a table based off of other rows and columns. Unlike VLOOKUP, INDEX can be used on rows, columns, or both at the same time. INDEX and MATCH are used together to perform some really advanced lookups.
The INDEX MATCH MATCH formula is the combination of two functions in Excel: INDEX and MATCH.
=INDEX() returns the value of a cell in a table based on the column and row number.
=MATCH() returns the position of a cell in a row or column.
Conditional Logic
This involves building conditional logic using if conditions, and using logical operators such as AND and OR to build formulas.
Array Formulas
Array formulas can perform multiple calculations on one or more of the items in an array.
Data Formatting
Formatting numbers as currency, percentages, conditional formatting, date formats, and custom number formats. For example, a number 200000000 can be formatted as ‘$200 million’.
Keyboard Shortcuts
As a pro excel user, one should be able to work with Excel using keyboard shortcuts. Almost everything in excel can be done using the shortcuts.
Charts
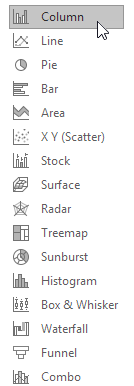
One should learn to make effective charts with multiple types such as a combination of line and bar chart, stacked bar charts, and so on. While it is easy to feed data to charts, to make them presentable and beautiful can require some skill and you will need to learn all formatting techniques for that.
Here are the chart types.
Building Financial Models
Building a financial model involves breaking up spreadsheets into input sheets, processing sheets and output sheets.
Solver and Goal Seek
These are a useful set of what-if analysis tools. For example, one can use them to reverse calculate variables such Implied volatility in Option pricing.
Pivot Tables
A pivot table is especially useful with large amounts of data Pivot tables can allows the users to organize, sort, and filter data in a very flexible style.
VBA and Macros
You should also acquire a basic understanding of Macros and VBA programming in excel. Macros can be helpful to automate frequently repeated tasks.
Finance Functions
One should learn to use inbuilt finance functions such as NPV, IRR, PV and other time value functions. An understanding of statistical and other excel functions is also
- XNPV
- XIRR
- MIRR
- PMT
- IPMT
- EFFECT
- DB
- RATE
- FV
- SLOPE
One should learn the above-mentioned function to master excel application, which will help them to maintain accounts and financial data easily.


1 Comment. Leave new
yeah its really needed for today