Defining a trend goes well beyond the obvious. You may notice that prices do not tend to move in a straight line in any direction in a given chart, but rather it moves in a series of highs and lows. In technical analysis, it is the movement of the highs and lows that constitutes a trend. For instance, an uptrend is classified as a series of higher highs and higher lows, while a downtrend is one of lower lows and lower highs.
There are 3 types of trends
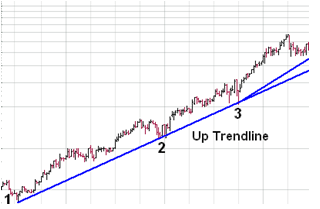
- Uptrend Line: An uptrend line is formed by connecting two or more low points and has a positive slope and. Uptrend lines act as support and indicate that net-demand is increasing even as the price rises. When the prices remain above the trend line, the uptrend is considered solid and intact and a break below the uptrend line indicates that net-demand has weakened and a change in trend could be imminent.
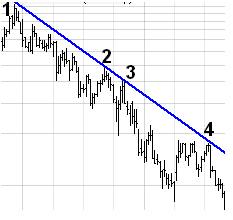
- Downtrend line: Downtrend line have a negative slope and is formed by connecting two or more high points. . Downtrend lines act as resistance, and indicate that net-supply (supply less demand) is increasing even as the price declines. As long as prices remain below the downtrend line, the downtrend is solid and intact. A break above the downtrend line indicates that net-supply is decreasing and that a change of trend could be imminent.
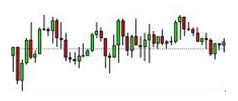
- Sideways Trend: As long as prices remain below the downtrend line, the downtrend is solid and intact. A break above the downtrend line indicates that net-supply is decreasing and that a change of trend could be imminent. Shares that fluctuate within a price range over a period of days, weeks, months, or even years are considered to be in a sideways trend.
Apply for Technical Analysis Certification Now!!
http://www.vskills.in/certification/Certified-Technical-Analyst
