What are the different Types of Charts in Foreign Exchange?
There are three main types of charts that are used by traders and investors based on the the information required and their individual skill levels.
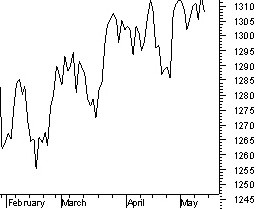
Line Chart
Line chart is the most elementary type of chart as it represents only closing price over a period of time. The line chart is formed by joining the closing price over a specified time period. No visual information of the trading range for the individual points such as the high, low and opening prices can be obtained. Line charts displays least amount of data and are used by traders who do not focus on details such as the open, high, and low prices
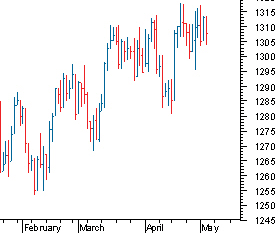
Bar Chart
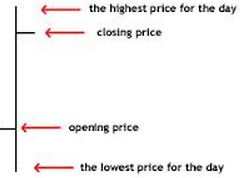
In addition to the closing price, bar charts also displays the open, high, and low prices for the time period selected. The chart is made up of a series of vertical lines that represents each data point. These vertical line represents the high and low for the trading period, along with the closing price. The opening and closing prices are represented on vertical line by a horizontal dash. The opening price is displayed by the dash that is located on the left side of the vertical bar and the closing price is represented by the dash on the right side of the vertical bar.
where,
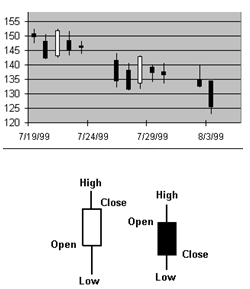
Candlestick Charts
Candlestick charts are somewhat similar to bar charts, but it differs in the way that it is visually constructed. The candlestick charts have a thin vertical line showing the range of the trading period similar to the bar charts, but the difference comes in the formation of a wide bar on the vertical line, indicating the difference between the opening and the closing price. Candlesticks rely heavily on the use of colors to explain what has happened during the trading period. Two color are used to indicate days up and days down. When the price of the stock is up and closes above the opening trade, the candlestick will usually be white or clear but if the stock has traded down for the period, then the candlestick will usually be red or black, accordingly. Note, if the stock’s price has closed above the previous day’s close but below the day’s open, the candlestick will be black or filled with the color that is used to indicate an up day.
Practice Questions
1: What are the types of charts used in foreign exchange?
A) Line charts, bar charts, and pie charts.
B) Area charts, scatter charts, and bubble charts.
C) Line charts, bar charts, and candlestick charts.
D) Radar charts, funnel charts, and gauge charts.
2: Which of the following charts is used to represent the price movement of a currency pair over a specific time period?
A) Line chart
B) Bar chart
C) Candlestick chart
D) All of the above
3: Which of the following charts shows the open, close, high, and low prices of a currency pair for a given time period?
A) Line chart
B) Bar chart
C) Candlestick chart
D) Area chart
4: Which of the following charts is used to show the price trend of a currency pair over a longer time period?
A) Line chart
B) Bar chart
C) Candlestick chart
D) Bubble chart
Answers:
- C
- D
- C
- A

Apply for Foreign Exchange Certification
https://www.vskills.in/certification/Certified-Foreign-Exchange-Professional
