Price Trends and Volume
Price Volume Trend combines percentage change in price and volume in order to confirm the strength of price trends or through divergences notification of weak price moves. In contrast to other price-volume indicators, the Price Volume Trend takes into account the percentage increase or decrease in price, rather than simply adding or subtracting volume – based on whether the current price is higher than the previous day’s price. The PVT is calculated by multiplying the day’s volume by the percent that the security’s price changed, and adding this value to a cumulative total.
Formula for PVT
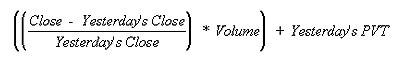
For example, if the security’s price increased 0.7% on volume of 20,000 shares, we would add 140 (i.e., 0.007 * 20,000) to the PVT. If the security’s price had closed down 0.7%, we would have subtracted 140 from the PVT.
Notes on Formula Calculation
- On an up day, the volume is multiplied by the percentage price increase between the current close and the previous time-period’s close. This value is then added to the previous day’s Price Volume Trend value.
- On a down day, the volume is multiplied by the percentage price decrease between the current close and the previous time-period’s close. This value is then added to the previous day’s Price Volume Trend value.
Apply for Technical Analysis Certification Now!!
http://www.vskills.in/certification/Certified-Technical-Analyst
