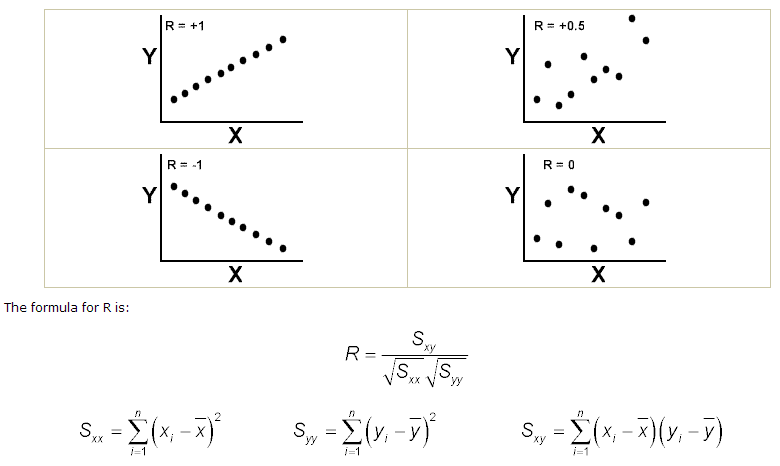
Correlation Coefficient- Correlation is a tool that is with a continuous x and a continuous y. The Pearson correlation coefficient (r) measures the linear relationship between the x and y as discussed earlier. Causation is different from correlation as the correlation is the mutual relationship that exists between two or more things while causation is the fact that something causes an effect. The correlation between two variables does not imply that one is as a result of the other. The correlation value ranges from -1 to 1. The closer to value 1 signifies positive relationship with x and y going in same direction similarly if nearing -1, both are in opposite direction and zero value means no relationship between the x and y.
Confidence in a relationship is computed both by the correlation coefficient and by the number of pairs in data. If there are very few pairs then the coefficient needs to be very close to 1 or –1 for it to be deemed ‘statistically significant’, but if there are many pairs then a coefficient closer to 0 can still be considered ‘highly significant’. The standard method used to measure the ‘significance’ of analysis is the p-value.
The coefficient of correlation is conventionally called ‘R’. Examples of values of R are:
Test Your Six Sigma Black Belt Skills By Taking Our Practice Tests on This Link
Apply for Six Sigma Black Belt Certification Now!!
http://www.vskills.in/certification/Certified-Six-Sigma-Black-Belt-Professional


