Analysis of Variance
ANOVA is used to determine if the average of a group of data is different than the average of other (multiple) groups of data. This tool is used in the ‘Analysis’ phase of a DMAIC Six Sigma project.
The statistical method is applied to test hypotheses among means from several populations. It assumes the sampled populations are normally distributed.
The Y-data is variable type of data (such as time).
The X-data is attribute data (such as appraiser name).
ANOVA is a hypothesis test for means (not median or mode) and usually is applied for testing >2 means. Use 1 sample t or 2 sample t test for one or two means-testing respectively.
It uses two components of variance and the F test to test the two components:
- BETWEEN sample variance
- WITHIN sample varianceBETWEEN sample variance is a study of the variation among all the samples usually due to process difference or factor changesWITHIN sample variance explains the variation within each sample itself (look at a Box Plot of one data set to graphically comprehend this – the tip of one whisker to another)ANOVA shows the right results if the means of several populations are statistically different or equal. It also computes a lot of other valuable insight that can help steer a GB/BB in clearer direction. A statistical difference is found when the difference BETWEEN samples is large enough “relative to the difference WITHIN the samples.
ANOVA Jargon
- Factor (Process Input Variable – PIV, x): A controlled or uncontrolled variable whose influence is being evaluated.
- Factor Level (+1,-1,Hi,Low,+,-,A,B,): Factor setting.
- Response(Process Output Variable – POV, y): The output of the process.
- Inference Space: Range of the factors being evaluated.
- Fit: Predicted value of the POV (y) with a specified setting of factors.
- Residual: Difference from a FIT (predicted output) from the actual experimental output.
One-Way ANOVA Example
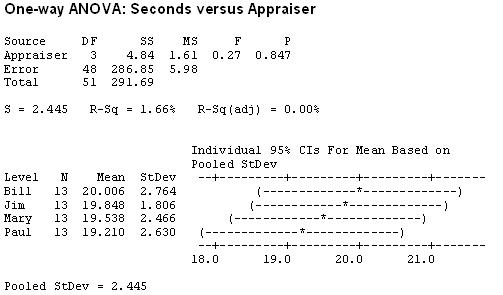
- Determine if there is a significant difference in two or more appraisers. The results of a mock study where four appraisers were timed to make an inspection decision on 13 widgets.
- All other criteria are equal.
- Since TIME is the only factor, this is a One-Factor or One-Way ANOVA. There are four levels that are controlled in the experiment, one being each appraiser.
- The first step is to create the test. In general, if the P-value is lower than the alpha-risk then the alternate hypothesis is inferred (reject the null).
Hypothesis Test:
Null Hypothesis: Population means of the different appraisers are equal.
Alternate Hypothesis: One of the means is not the same
- There are 51 Degrees of Freedom computed from (13*4)-1.
- Using a One-Way test with alpha at 0.05,the P-value is well above 0.05 at 0.847, f-statistic, and heavily overlapping confidence intervals are all evidence that there is no difference among any pairs or combinations of them.
- It is concluded that there is not a statistical difference between any of the appraisers.
- If the P was <0.05, then at least one group of data is different than at least one other group.
- The low F-value of 0.27 says the variation within the appraisers is greater than the variation between them. The F-critical value is 2.81.
- It is advisable to a project manager to re-running (depending on cost and time) the trial with a larger sample size and additional appraiser training to reduce the variation within each one. The variation is fairly consistent among each of them so it appears there is a systemic issue.
Two-Way ANOVA
Other factors can be added to this type of test and get more complicated but most statistical software programs can run Two-Way and Three-Way ANOVA.
Two-Way Hypothesis Tests:
Null Hypothesis: There is no difference in the means of the 1st factor
Null Hypothesis: There is no difference in means of the 2nd factor
Null Hypothesis: There is no interaction between the two factors
Alternate Hypothesis: Means are not equal among the levels of the 1st factor
Alternate Hypothesis: Means are not equal among the levels of the 2nd factor
Alternate Hypothesis: There is an interaction between the two factors
Test Your Six Sigma Black Belt Skills By Taking Our Practice Tests on This Link
Apply for Six Sigma Black Belt Certification Now!!
http://www.vskills.in/certification/Certified-Six-Sigma-Black-Belt-Professional


