Certify and Increase Opportunity.
Be
Govt. Certified Linux Administrator
Various network security tools are available for Linux which are open source. Few important ones are discussed.
Nmap
Nmap (“Network Mapper”) is a free and open source utility for network exploration and security auditing. Many systems and network administrators also find it useful for tasks such as network inventory, managing service upgrade schedules, and monitoring host or service uptime. Nmap uses raw IP packets in novel ways to determine what hosts are available on the network, what services (application name and version) those hosts are offering, what operating systems (and OS versions) they are running, what type of packet filters/firewalls are in use, and dozens of other characteristics. It was designed to rapidly scan large networks, but works fine against single hosts. Nmap runs on all major computer operating systems, and both console and graphical versions are available.
The result of running nmap is usually a list of interesting ports on the machine(s) being scanned (if any). Nmap always gives the port’s “well known” service name (if any), number, state, and protocol. The state is either “open”, “filtered”, or “unfiltered”. Open means that the target machine will accept() connections on that port. Filtered means that a firewall, filter, or other network obstacle is covering the port and preventing nmap from determining whether the port is open. Unfiltered means that the port is known by nmap to be closed and no firewall/filter seems to be interfering with nmap’s attempts to determine this. Unfiltered ports are the common case and are only shown when most of the scanned ports are in the filtered state.
Depending on options used, nmap may also report the following characteristics of the remote host: OS in use, TCP sequentiality, usernames running the programs which have bound to each port, the DNS name, whether the host is a smurf address, and a few others.
Nmap Command
Usage: nping [Probe mode] [Options] {target specification}
TARGET SPECIFICATION:
Targets may be specified as hostnames, IP addresses, networks, etc.
Ex: scanme.nmap.org, microsoft.com/24, 192.168.0.1; 10.0.*.1-24
PROBE MODES:
–tcp-connect : Unprivileged TCP connect probe mode.
–tcp : TCP probe mode.
–udp : UDP probe mode.
–icmp : ICMP probe mode.
–arp : ARP/RARP probe mode.
–tr, –traceroute : Traceroute mode (can only be used with
TCP/UDP/ICMP modes).
TCP CONNECT MODE:
-p, –dest-port <port spec> : Set destination port(s).
-g, –source-port <portnumber> : Try to use a custom source port.
TCP PROBE MODE:
-g, –source-port <portnumber> : Set source port.
-p, –dest-port <port spec> : Set destination port(s).
–seq <seqnumber> : Set sequence number.
–flags <flag list> : Set TCP flags (ACK,PSH,RST,SYN,FIN…)
–ack <acknumber> : Set ACK number.
–win <size> : Set window size.
–badsum : Use a random invalid checksum.
UDP PROBE MODE:
-g, –source-port <portnumber> : Set source port.
-p, –dest-port <port spec> : Set destination port(s).
–badsum : Use a random invalid checksum.
ICMP PROBE MODE:
–icmp-type <type> : ICMP type.
–icmp-code <code> : ICMP code.
–icmp-id <id> : Set identifier.
–icmp-seq <n> : Set sequence number.
–icmp-redirect-addr <addr> : Set redirect address.
–icmp-param-pointer <pnt> : Set parameter problem pointer.
–icmp-advert-lifetime <time> : Set router advertisement lifetime.
–icmp-advert-entry <IP,pref> : Add router advertisement entry.
–icmp-orig-time <timestamp> : Set originate timestamp.
–icmp-recv-time <timestamp> : Set receive timestamp.
–icmp-trans-time <timestamp> : Set transmit timestamp.
ARP/RARP PROBE MODE:
–arp-type <type> : Type: ARP, ARP-reply, RARP, RARP-reply.
–arp-sender-mac <mac> : Set sender MAC address.
–arp-sender-ip <addr> : Set sender IP address.
–arp-target-mac <mac> : Set target MAC address.
–arp-target-ip <addr> : Set target IP address.
IPv4 OPTIONS:
-S, –source-ip : Set source IP address.
–dest-ip <addr> : Set destination IP address (used as an
alternative to {target specification} ).
–tos <tos> : Set type of service field (8bits).
–id <id> : Set identification field (16 bits).
–df : Set Don’t Fragment flag.
–mf : Set More Fragments flag.
–ttl <hops> : Set time to live [0-255].
–badsum-ip : Use a random invalid checksum.
–ip-options <S|R [route]|L [route]|T|U …> : Set IP options
–ip-options <hex string> : Set IP options
–mtu <size> : Set MTU. Packets get fragmented if MTU is
small enough.
IPv6 OPTIONS:
-6, –IPv6 : Use IP version 6.
–dest-ip : Set destination IP address (used as an
alternative to {target specification}).
–hop-limit : Set hop limit (same as IPv4 TTL).
–traffic-class <class> : : Set traffic class.
–flow <label> : Set flow label.
ETHERNET OPTIONS:
–dest-mac <mac> : Set destination mac address. (Disables
ARP resolution)
–source-mac <mac> : Set source MAC address.
–ether-type <type> : Set EtherType value.
PAYLOAD OPTIONS:
–data <hex string> : Include a custom payload.
–data-string <text> : Include a custom ASCII text.
–data-length <len> : Include len random bytes as payload.
ECHO CLIENT/SERVER:
–echo-client <passphrase> : Run Nping in client mode.
–echo-server <passphrase> : Run Nping in server mode.
–echo-port <port> : Use custom <port> to listen or connect.
–no-crypto : Disable encryption and authentication.
–once : Stop the server after one connection.
–safe-payloads : Erase application data in echoed packets.
TIMING AND PERFORMANCE:
Options which take <time> are in seconds, or append ‘ms’ (milliseconds),
‘s’ (seconds), ‘m’ (minutes), or ‘h’ (hours) to the value (e.g. 30m, 0.25h).
–delay <time> : Adjust delay between probes.
–rate <rate> : Send num packets per second.
MISC:
-h, –help : Display help information.
-V, –version : Display current version number.
-c, –count <n> : Stop after <n> rounds.
-e, –interface <name> : Use supplied network interface.
-H, –hide-sent : Do not display sent packets.
-N, –no-capture : Do not try to capture replies.
–privileged : Assume user is fully privileged.
–unprivileged : Assume user lacks raw socket privileges.
–send-eth : Send packets at the raw Ethernet layer.
–send-ip : Send packets using raw IP sockets.
–bpf-filter <filter spec> : Specify custom BPF filter.
OUTPUT:
-v : Increment verbosity level by one.
-v[level] : Set verbosity level. E.g: -v4
-d : Increment debugging level by one.
-d[level] : Set debugging level. E.g: -d3
-q : Decrease verbosity level by one.
-q[N] : Decrease verbosity level N times
–quiet : Set verbosity and debug level to minimum.
–debug : Set verbosity and debug to the max level.
EXAMPLES:
nping scanme.nmap.org
nping –tcp -p 80 –flags rst –ttl 2 192.168.1.1
nping –icmp –icmp-type time –delay 500ms 192.168.254.254
nping –echo-server “public” -e wlan0 -vvv
nping –echo-client “public” echo.nmap.org –tcp -p1-1024 –flags ack
Usage – The basic syntax for Nmap is Nmap Scan Type Options target. Let’s say you want to scan a host to see what operating system it is running. To do this, run the following:
nmap -O target.host.com
Note that Nmap requires root privileges to run this type of scan. The scan might take a minute or so to run, so be patient. When it finishes, you’ll see something like this:
Starting Nmap 5.21 ( http://nmap.org ) at 2010-02-27 23:52 EST
Nmap scan report for 10.0.0.1
Host is up (0.0015s latency).
Not shown: 997 closed ports
PORT STATE SERVICE
53/tcp open domain
5009/tcp open airport-admin
10000/tcp open snet-sensor-mgmt
MAC Address: 00:11:24:6B:43:E2 (Apple Computer)
Device type: WAP|printer
Running: Apple embedded, Canon embedded, Kyocera embedded, Xerox embedded
OS details: VxWorks: Apple AirPort Extreme v5.7 or AirPort Express v6.3; Canon imageRUNNER printer (5055, C3045, C3380, or C5185); Kyocera FS-4020DN printer; or Xerox Phaser 8860MFP printer
Network Distance: 1 hop
OS detection performed. Please report any incorrect results at http://nmap.org/submit/ .
Nmap done: 1 IP address (1 host up) scanned in 10.21 seconds
As you can see, Nmap provides a lot of data. Here it takes a guess at the operating system that might be running on the system. I ran this particular scan against an Apple Airport Extreme router. As an added bonus, Nmap tells me that the device is one hop away, the MAC address of the device and manufacturer of the NIC, the open ports, and how long the scan took.
Here’s the result of another scan, against a desktop machine running Ubuntu 9.10:
Starting Nmap 5.21 ( http://nmap.org ) at 2010-02-28 00:00 EST
Nmap scan report for 10.0.0.6
Host is up (0.0039s latency).
Not shown: 999 closed ports
PORT STATE SERVICE
22/tcp open ssh
MAC Address: 00:17:08:2A:D6:F0 (Hewlett Packard)
Device type: general purpose
Running: Linux 2.6.X
OS details: Linux 2.6.19 – 2.6.31
Network Distance: 1 hop
OS detection performed. Please report any incorrect results at http://nmap.org/submit/ .
Nmap done: 1 IP address (1 host up) scanned in 3.40 seconds
Here we see that the system has an HP NIC (it’s an HP workstation), running the Linux kernel somewhere between Linux 2.6.19 and 2.6.31. You may not be able to get an explicit identification of the operating system down to the version of Linux.
Practice Hosts – In the examples above, I chose a local router and one of my workstations in part because I have the permission to scan them. You can use Nmap to scan virtually any host. However, it’s a bad idea to run many scans against hosts you’re not in control of or don’t have permission to scan. The Nmap folks have a test host at scanme.nmap.org that can be used for testing, so long as you’re not running any tests of exploits or Denial of Service (DoS) attacks.
Some admins don’t appreciate unexpected scans, so use best judgment and restrict scans to hosts that are on your own network or that you have permission to scan. It may also be against your ISP’s terms of service to use some of Nmap’s more aggressive scan features, so be careful out there!
Multiple Hosts – You can scan more than one host at a time using nmap. If you’re using IP addresses, you can specify a range like 10.0.0.1-6 or a range like 10.0.0.0/24. The 10.0.0.1-6 would scan hosts 10.0.0.1, 10.0.0.2, 10.0.0.3 through 10.0.0.6. Using the /24 notation would scan the whole range of hosts from 10.0.0.0 to 10.0.0.255. For example, to scan 10.0.0.1 through 10.0.0.42 to learn what OS they might be running I’d use nmap -O 10.0.0.1-42.
If you have hostnames instead of IP addresses, you can separate them with a space on the command line, like so:
nmap -O host1.target.com host2.target.com
Checking Open Ports – If you give Nmap no options at all and just point it at a given host it will scan for open ports and report back those that are open, and what service is running on them. For instance, running nmap target.hostname.com might yield something like this:
Interesting ports on target.hostname.com (10.0.0.88):
Not shown: 1711 closed ports
PORT STATE SERVICE
22/tcp open ssh
80/tcp open http
3306/tcp open mysql
Nmap done: 1 IP address (1 host up) scanned in 0.228 seconds
Here you can see that there are three ports open: 22, 80, and 3306 which run SSH, HTTP, and MySQL respectively. Nmap recognizes six states: open, closed, filtered, unfiltered, open|filtered, and closed|filtered. These are mostly self-explanatory. If Nmap can tell what service is running, it will report it under the SERVICE column.
If you’d like a little more information, crank it up a notch by adding one or two -v options to the command. For example, using nmap -vv host.target.com would produce something like this:
Initiating Ping Scan at 11:44
Scanning 10.0.0.28 [1 port]
Completed Ping Scan at 11:44, 0.00s elapsed (1 total hosts)
Initiating Parallel DNS resolution of 1 host. at 11:44
Completed Parallel DNS resolution of 1 host. at 11:44, 0.00s elapsed
Initiating Connect Scan at 11:44
Scanning host.target.com (10.0.0.28) [1714 ports]
Discovered open port 22/tcp on 10.0.0.28
Discovered open port 80/tcp on 10.0.0.28
Discovered open port 3306/tcp on 10.0.0.28
Completed Connect Scan at 11:44, 0.08s elapsed (1714 total ports)
Host host.target.com (10.0.0.28) appears to be up … good.
Interesting ports on host.target.com (10.0.0.28):
Not shown: 1711 closed ports
PORT STATE SERVICE
22/tcp open ssh
80/tcp open http
3306/tcp open mysql
Read data files from: /usr/share/nmap
Nmap done: 1 IP address (1 host up) scanned in 0.104 seconds
Nmap provides a lot more information when using the verbose (-v) option.
Service Scans – If you’re really curious about what services a host might be running, try the -sV options. This will do a more aggressive scan to try to figure out what versions of services are running on a given host, and also might help determine more specifically what OS a host is running. For instance, I ran nmap -sV against a test server and got this in response:
Starting Nmap 5.21 ( http://nmap.org ) at 2010-02-28 00:15 EST
Nmap scan report for test.host.net (XX.XXX.XXX.XX)
Host is up (0.090s latency).
Not shown: 965 closed ports, 33 filtered ports
PORT STATE SERVICE VERSION
22/tcp open ssh OpenSSH 4.7p1 Debian 8ubuntu1.2 (protocol 2.0)
80/tcp open http Apache httpd 2.2.8 ((Ubuntu) PHP/5.2.4-2ubuntu5.10 with Suhosin-Patch)
Service Info: OS: Linux
Service detection performed. Please report any incorrect results at http://nmap.org/submit/ .
Nmap done: 1 IP address (1 host up) scanned in 11.43 seconds
As you can see, Nmap can “fingerprint” the packets and identify the versions of the software running on the SSH and HTTP ports. Here you can see that the system being pinged is a Ubuntu box with Apache 2.2.8 and OpenSSH 4.7p1. This can be useful for a number of reasons. A quick Nmap scan can identify systems that are running unpatched systems and therefore ones that might be vulnerable to known exploits.
Snort
Snort is a free and open source network intrusion prevention system (NIPS) and network intrusion detection system (NIDS) created by Martin Roesch in 1998. Snort is now developed by Sourcefire, of which Roesch is the founder and CTO, and which has been owned by Cisco since 2013.
Snort’s open source network-based intrusion detection system (NIDS) has the ability to perform real-time traffic analysis and packet logging on Internet Protocol (IP) networks. Snort performs protocol analysis, content searching and matching. These basic services have many purposes including application-aware triggered quality of service, to de-prioritize bulk traffic when latency-sensitive applications are in use.
The program can also be used to detect probes or attacks, including, but not limited to, operating system fingerprinting attempts, common gateway interface, buffer overflows, server message block probes, and stealth port scans.
Snort can be configured in three main modes: sniffer, packet logger, and network intrusion detection. In sniffer mode, the program will read network packets and display them on the console. In packet logger mode, the program will log packets to the disk. In intrusion detection mode, the program will monitor network traffic and analyze it against a rule set defined by the user. The program will then perform a specific action based on what has been identified
Snort can be configured to run in three modes:
- Sniffer mode, which simply reads the packets off of the network and displays them for you in a continuous stream on the console (screen).
- Packet Logger mode, which logs the packets to disk.
- Network Intrusion Detection System (NIDS) mode, which performs detection and analysis on network traffic. This is the most complex and configurable mode.
Sniffer Mode – First, let’s start with the basics. If you just want to print out the TCP/IP packet headers to the screen (i.e. sniffer mode), try this:
./snort -v
This command will run Snort and just show the IP and TCP/UDP/ICMP headers, nothing else. If you want to see the application data in transit, try the following:
./snort -vd
This instructs Snort to display the packet data as well as the headers. If you want an even more descriptive display, showing the data link layer headers, do this:
./snort -vde
As an aside, notice that the command line switches can be listed separately or in a combined form. The last command could also be typed out as:
./snort -d -v -e
to produce the same result.
Packet Logger Mode – OK, all of these commands are pretty cool, but if you want to record the packets to the disk, you need to specify a logging directory and Snort will automatically know to go into packet logger mode:
./snort -dev -l ./log
Of course, this assumes you have a directory named log in the current directory. If you don’t, Snort will exit with an error message. When Snort runs in this mode, it collects every packet it sees and places it in a directory hierarchy based upon the IP address of one of the hosts in the datagram.
If you just specify a plain -l switch, you may notice that Snort sometimes uses the address of the remote computer as the directory in which it places packets and sometimes it uses the local host address. In order to log relative to the home network, you need to tell Snort which network is the home network:
./snort -dev -l ./log -h 192.168.1.0/24
This rule tells Snort that you want to print out the data link and TCP/IP headers as well as application data into the directory ./log, and you want to log the packets relative to the 192.168.1.0 class C network. All incoming packets will be recorded into subdirectories of the log directory, with the directory names being based on the address of the remote (non-192.168.1) host.
Network Intrusion Detection System Mode – To enable Network Intrusion Detection System (NIDS) mode so that you don’t record every single packet sent down the wire, try this:
./snort -dev -l ./log -h 192.168.1.0/24 -c snort.conf
where snort.conf is the name of your snort configuration file. This will apply the rules configured in the snort.conf file to each packet to decide if an action based upon the rule type in the file should be taken. If you don’t specify an output directory for the program, it will default to /var/log/snort.
One thing to note about the last command line is that if Snort is going to be used in a long term way as an IDS, the -v switch should be left off the command line for the sake of speed. The screen is a slow place to write data to, and packets can be dropped while writing to the display.
It’s also not necessary to record the data link headers for most applications, so you can usually omit the -e switch, too.
./snort -d -h 192.168.1.0/24 -l ./log -c snort.conf
This will configure Snort to run in its most basic NIDS form, logging packets that trigger rules specified in the snort.conf in plain ASCII to disk using a hierarchical directory structure (just like packet logger mode).
There are a number of ways to configure the output of Snort in NIDS mode. The default logging and alerting mechanisms are to log in decoded ASCII format and use full alerts. The full alert mechanism prints out the alert message in addition to the full packet headers. There are several other alert output modes available at the command line, as well as two logging facilities.
Alert modes are somewhat more complex. There are seven alert modes available at the command line: full, fast, socket, syslog, console, cmg, and none. Six of these modes are accessed with the -A command line switch. These options are:
| Option | Description |
| -A fast | Fast alert mode. Writes the alert in a simple format with a timestamp, alert message, source and destination IPs/ports. |
| -A full | Full alert mode. This is the default alert mode and will be used automatically if you do not specify a mode. |
| -A unsock | Sends alerts to a UNIX socket that another program can listen on. |
| -A none | Turns off alerting. |
| -A console | Sends “fast-style” alerts to the console (screen). |
| -A cmg | Generates “cmg style” alerts. |
Packets can be logged to their default decoded ASCII format or to a binary log file via the -b command line switch. To disable packet logging altogether, use the -N command line switch.
To send alerts to syslog, use the -s switch. The default facilities for the syslog alerting mechanism are LOG_AUTHPRIV and LOG_ALERT. If you want to configure other facilities for syslog output, use the output plugin directives in snort.conf.
For example, use the following command line to log to default (decoded ASCII) facility and send alerts to syslog:
./snort -c snort.conf -l ./log -h 192.168.1.0/24 -s
As another example, use the following command line to log to the default facility in /var/log/snort and send alerts to a fast alert file:
./snort -c snort.conf -A fast -h 192.168.1.0/24
Understanding Standard Alert Output – When Snort generates an alert message, it will usually look like the following:
[**] [116:56:1] (snort_decoder): T/TCP Detected [**]The first number is the Generator ID, this tells the user what component of Snort generated this alert. For a list of GIDs, please read etc/generators in the Snort source. In this case, we know that this event came from the “decode” (116) component of Snort.
The second number is the Snort ID (sometimes referred to as Signature ID). For a list of preprocessor SIDs, please see etc/gen-msg.map. Rule-based SIDs are written directly into the rules with the sid option. In this case, 56 represents a T/TCP event.
The third number is the revision ID. This number is primarily used when writing signatures, as each rendition of the rule should increment this number with the rev option.
Packet Acquisition – Snort 2.9 introduces the DAQ, or Data Acquisition library, for packet I/O. The DAQ replaces direct calls to libpcap functions with an abstraction layer that facilitates operation on a variety of hardware and software interfaces without requiring changes to Snort. It is possible to select the DAQ type and mode when invoking Snort to perform pcap readback or inline operation, etc.
Nessus
Nessus is a proprietary vulnerability scanner which is developed by Tenable Network Security. It is free of charge for personal use in a non-enterprise environment. Nessus allows scans for the following types of vulnerabilities:
- Vulnerabilities that allow a remote hacker to control or access sensitive data on a system.
- Misconfiguration (e.g. open mail relay, missing patches, etc.).
- Default passwords, a few common passwords, and blank/absent passwords on some system accounts. Nessus can also call Hydra (an external tool) to launch a dictionary attack.
- Denials of service against the TCP/IP stack by using malformed packets
Initially, Nessus consisted of two main components; nessusd, the Nessus daemon, which does the scanning, and nessus, the client, which controls scans and presents the vulnerability results to the user. Later versions of Nessus (4 and greater) utilize a web server which provides the same functionality as the client.
In typical operation, Nessus begins by doing a port scan with one of its four internal portscanners (or it can optionally use AmapM or Nmap) to determine which ports are open on the target and then tries various exploits on the open ports. The vulnerability tests, available as subscriptions, are written in NASL(Nessus Attack Scripting Language), a scripting language optimized for custom network interaction.
The Nessus tool works a little differently than other scanners. Rather than purporting to offer a single, all-encompassing vulnerability database that gets updated regularly, Nessus supports the Nessus Attack Scripting Language (NASL), which allows security professionals to use a simple language to describe individual attacks. Nessus administrators then simply include the NASL descriptions of all desired vulnerabilities to develop their own customized scans.
The Nessus plugins (the scripts that provide the scanning functionality of Nessus) change frequently. Get updated plugins from the official site on a regular basis. After completing the Nessus installation wizard, you’ll be asked if you’d like to update the plugins immediately. If you didn’t choose this option or you wish to update the plugins at a later date, choose Tenable Network Security -> Nessus -> Plugin Update from the Windows Start menu. By default, Nessus will automatically update itself every 24 hours.
Typically after a new vulnerability is released to the public, someone in the Nessus community writes a NASL plug-in, releases it to the public and submits it to www.nessus.org. It is then reviewed by the developers and added to the approved plug-in list. For high risk, high profile vulnerabilities a plug-in is often released the same day the vulnerability information is publicly released. Updating plug-ins from the maintained list is fairly simple involving a simple command: nessus-update-plugins. This command must be done as root. By no means however, are you limited to the list of plug-ins from www.nessus.org. New and special purpose plug-ins can be written relatively easily using NASL, so you can write your own custom plug-ins as well.
Launch the daemon – Nessus is now installed, updated and ready to go. The simplest way to get the server running is (as root) issue the nessusd -D command. In order to use it, one must use a client. There are three primary Nessus clients. The native Unix GUI version is installed at server install time. Alternatively, Nessus can be controlled from the command line. A third option, a Windows version also exists called NessusWX. The binaries for NessusWX can be found here . The NessusWX install is a straightforward Windows install. All three clients work well. Personally I prefer NessusWX. It is better organized, allows for easier reporting, and has a better facility for managing different sessions (groups of hosts to scan) then its Unix counterparts. To run the native Unix GUI client, run the nessus command or for NessusWX click the eye icon after installation.
Client connection – Since Nessus is a client server technology, once running the client a connection must be made to the server. In the native client, enter the server IP, username and password (created with the nessus-adduser command) and hit login. The process in NessusWX is similar but uses the communications | connect menus. The client is connected to the server thru an SSL connection and a list of the currently installed plug-ins is downloaded. On the first run the SSL certificate is also downloaded and verification is requested. This verification ensures that in the future you are actually communicating with the server intended.
Port scanning – The other critical part of the scanning process is port scanning. Port scanning is the process by which the active ports for an IP address are identified. Each port is tied to a specific application. Nessus is a smart scanner and only runs a test if the specific program for that test is available. For example, only Web server plug-ins are run if a Web server is found. Since often ports are changed from their default to hide them, Nessus has a plug-in called services. The services plug-in attempts to identify the program running on each port. Once the program is identified, only the user-selected and pertinent plug-ins are run against it.
Nessus has several options to scan for ports. There is the built-in wrapper for NMAP, widely acknowledged as the best port scanner around. There is also an internal scanner and a custom ping scan. As with plug-in selection, port scanning is very dependent on the situation. For a simple scan, the internal “sync” scan using default parameters with pings enabled, found on the “Perf” tab of the Unix GUI and the Port scan tab of NessusWX, is sufficient.
Identify targets – The final task is to identify your targets. This is done on the targets tab. Targets can be specified as a single IP Address, as a subnet or as a range of IP addresses. I normally try to break them down into logical groups. It is typically easier to deal with smaller groups at one time.
Start a scan – With your Nessus client and server in hand you are ready to scan systems. To start a scan in the Unix GUI just click “Start Scan” at the bottom of the window. In NessusWX, right click the desired session and select Execute. Properly used, Nessus can and will pinpoint problems and provide solutions. However, misused it can and will crash systems, cause the loss of data, and possibly cost you your job. As with anything powerful, there comes risk and responsibilities. Scanned systems sometimes will crash. Don’t scan any system without permission. I suggest your first scan be against your own isolated test system.
Wireshark
Wireshark is a Free and Open packet analyzer. It is used for network troubleshooting, analysis, software and communications protocol development, and education. Wireshark is a network packet analyzer. A network packet analyzer will try to capture network packets and tries to display that packet data as detailed as possible. Here are some examples people use Wireshark for
- Network administrators use it to troubleshoot network problems
- Network security engineers use it to examine security problems
- Developers use it to debug protocol implementations
- People use it to learn network protocol internals
After downloading and installing Wireshark, you can launch it and click the name of an interface under Interface List to start capturing packets on that interface. For example, if you want to capture traffic on the wireless network, click your wireless interface. You can configure advanced features by clicking Capture Options, but this isn’t necessary for now.
As soon as you click the interface’s name, you’ll see the packets start to appear in real time. Wireshark captures each packet sent to or from your system. If you’re capturing on a wireless interface and have promiscuous mode enabled in your capture options, you’ll also see other the other packets on the network.
Click the stop capture button near the top left corner of the window when you want to stop capturing traffic.
Color Coding – You’ll probably see packets highlighted in green, blue, and black. Wireshark uses colors to help you identify the types of traffic at a glance. By default, green is TCP traffic, dark blue is DNS traffic, light blue is UDP traffic, and black identifies TCP packets with problems — for example, they could have been delivered out-of-order.
Sample Captures – If there’s nothing interesting on your own network to inspect. Opening a capture file is easy; just click Open on the main screen and browse for a file. You can also save your own captures in Wireshark and open them later.
Filtering Packets – If you’re trying to inspect something specific, such as the traffic a program sends when phoning home, it helps to close down all other applications using the network so you can narrow down the traffic. Still, you’ll likely have a large amount of packets to sift through. That’s where Wireshark’s filters come in.
The most basic way to apply a filter is by typing it into the filter box at the top of the window and clicking Apply (or pressing Enter). For example, type “dns” and you’ll see only DNS packets. When you start typing, Wireshark will help you autocomplete your filter.
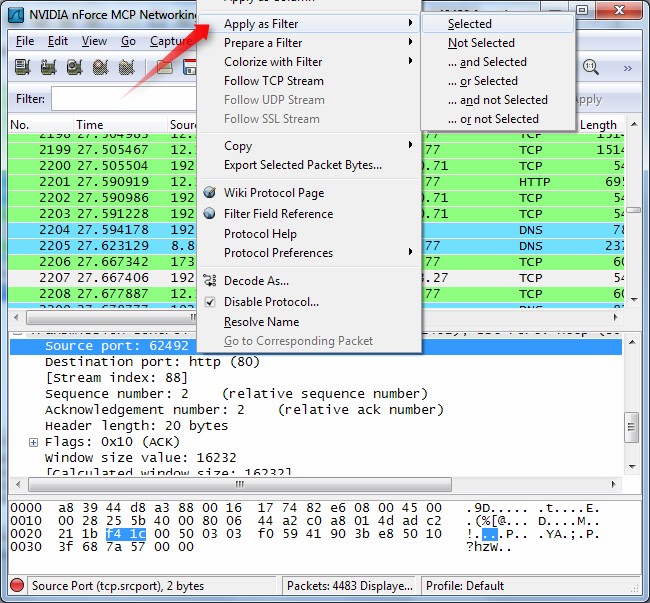
You can also click the Analyze menu and select Display Filters to create a new filter. Another interesting thing you can do is right-click a packet and select Follow TCP Stream. You’ll see the full conversation between the client and the server. Close the window and you’ll find a filter has been applied automatically — Wireshark is showing you the packets that make up the conversation.
Inspecting Packets – Click a packet to select it and you can dig down to view its details. You can also create filters from here — just right-click one of the details and use the Apply as Filter submenu to create a filter based on it.
Apply for Linux Administration Certification Now!!
http://www.vskills.in/certification/Certified-Linux-Administrator
