Classification is a data mining function that assigns items in a collection to target categories or classes. The goal of classification is to accurately predict the target class for each case in the data. For example, a classification model could be used to identify loan applicants as low, medium, or high credit risks.
A classification task begins with a data set in which the class assignments are known. For example, a classification model that predicts credit risk could be developed based on observed data for many loan applicants over a period of time. In addition to the historical credit rating, the data might track employment history, home ownership or rental, years of residence, number and type of investments, and so on. Credit rating would be the target, the other attributes would be the predictors, and the data for each customer would constitute a case.
Classifications are discrete and do not imply order. Continuous, floating-point values would indicate a numerical, rather than a categorical, target. A predictive model with a numerical target uses a regression algorithm, not a classification algorithm.
The simplest type of classification problem is binary classification. In binary classification, the target attribute has only two possible values: for example, high credit rating or low credit rating. Multiclass targets have more than two values: for example, low, medium, high, or unknown credit rating.
In the model build (training) process, a classification algorithm finds relationships between the values of the predictors and the values of the target. Different classification algorithms use different techniques for finding relationships. These relationships are summarized in a model, which can then be applied to a different data set in which the class assignments are unknown.
Classification models are tested by comparing the predicted values to known target values in a set of test data. The historical data for a classification project is typically divided into two data sets: one for building the model; the other for testing the model.
Scoring a classification model results in class assignments and probabilities for each case. For example, a model that classifies customers as low, medium, or high value would also predict the probability of each classification for each customer.
Classification has many applications in customer segmentation, business modeling, marketing, credit analysis, and biomedical and drug response modeling.
Classification consists of predicting a certain outcome based on a given input. In order to predict the outcome, the algorithm processes a training set containing a set of attributes and the respective outcome, usually called goal or prediction attribute. The algorithm tries to discover relationships between the attributes that would make it possible to predict the outcome. Next the algorithm is given a data set not seen before, called prediction set, which contains the same set of attributes, except for the prediction attribute – not yet known. The algorithm analyses the input and produces a prediction. The prediction accuracy defines how “good” the algorithm is.
Example
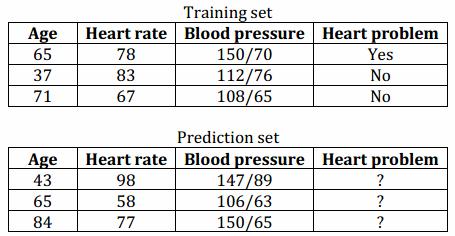
In a medical database the training set would have relevant patient information recorded previously, where the prediction attribute is whether or not the patient had a heart problem. Table below illustrates the training and prediction sets of such database.
Among several types of knowledge representation present in the literature, classification normally
uses prediction rules to express knowledge. Prediction rules are expressed in the form of IF-THEN rules, where the antecedent (IF part) consists of a conjunction of conditions and the rule consequent (THEN part) predicts a certain predictions attribute value for an item that satisfies the antecedent. Using the example above, a rule predicting the first row in the training set may be represented as following:
IF (Age=65 AND Heart rate>70) OR (Age>60 AND Blood pressure>140/70)
THEN Heart problem=yes
In most cases the prediction rule is immensely larger than the example above. Conjunction has a nice property for classification; each condition separated by OR’s defines smaller rules that captures relations between attributes. Satisfying any of these smaller rules means that the consequent is the prediction. Each smaller rule is formed with AND’s which facilitates narrowing down relations between attributes.
How well predictions are done is measured in percentage of predictions hit against the total
number of predictions. A decent rule ought to have a hit rate greater than the occurrence of the prediction attribute. In other words, if the algorithm is trying to predict rain in Seattle and it rains 80% of the time, the algorithm could easily have a hit rate of 80% by just predicting rain all the time. Therefore, 80% is the base prediction rate that any algorithm should achieve in this case. The optimal solution is a rule with 100% prediction hit rate, which is very hard, when not impossible, to achieve. Therefore, except for some very specific problems, classification by definition can only be solved by approximation algorithms.
Lift
Lift measures the degree to which the predictions of a classification model are better than randomly-generated predictions. Lift applies to binary classification only, and it requires the designation of a positive class.
If the model itself does not have a binary target, you can compute lift by designating one class as positive and combining all the other classes together as one negative class.
Numerous statistics can be calculated to support the notion of lift. Basically, lift can be understood as a ratio of two percentages: the percentage of correct positive classifications made by the model to the percentage of actual positive classifications in the test data. For example, if 40% of the customers in a marketing survey have responded favorably (the positive classification) to a promotional campaign in the past and the model accurately predicts 75% of them, the lift would be obtained by dividing .75 by .40. The resulting lift would be 1.875.
Lift is computed against quantiles that each contain the same number of cases. The data is divided into quantiles after it is scored. It is ranked by probability of the positive class from highest to lowest, so that the highest concentration of positive predictions is in the top quantiles. A typical number of quantiles is 10.
Classification Issues
The major issue is preparing the data for classification involves the following activities
- Data Cleaning − Data cleaning involves removing the noise and treatment of missing values. The noise is removed by applying smoothing techniques and the problem of missing values is solved by replacing a missing value with most commonly occurring value for that attribute.
- Relevance Analysis − Database may also have the irrelevant attributes. Correlation analysis is used to know whether any two given attributes are related.
- Data Transformation and reduction − The data can be transformed by any of the following methods.
- Normalization − The data is transformed using normalization. Normalization involves scaling all values for given attribute in order to make them fall within a small specified range. Normalization is used when in the learning step, the neural networks or the methods involving measurements are used.
- Generalization − The data can also be transformed by generalizing it to the higher concept. For this purpose we can use the concept hierarchies.
