Simple Moving Average (SMA) Model
Moving averages smooths the price changes to give a general indication of the trend of a security. They do not predict price direction, but rather define the current direction with a lag. Moving averages lag because they are based on past prices. Despite this lag, moving averages help smooth price action and filter out the noise.
They also form the building blocks for many other technical indicators and overlays, such as Bollinger Bands, MACD and the McClellan Oscillator.
The simple moving average formula is calculated by taking the average closing price of a stock over the last “x” periods.
For example, the last five closing prices for ABCD are:
28.93+28.48+28.44+28.91+28.48 = 143.24
To calculate the simple moving average formula you divide the total of the closing prices and divide it by the number of periods.
5-day SMA = 143.24/5 = 28.65
The Simple Moving Average (SMA) and the Exponential Moving Average (EMA) are the two most popular types of moving averages. These moving averages can be used to identify the direction of the trend or define potential support and resistance levels.
The simple moving average is the most basic of the moving averages. It is calculated by taking the past x number of points averaging them, and then plotting the resulting line on a chart. The reason it is called a moving average is because as new data points become available the average moves forward to incorporate the new data point and drops the last data point in the series.
Example: A trader plots a 10-day moving average on a chart. The last 10 days of trading are averaged to equal the most recent point plotted on the moving average line on the chart.
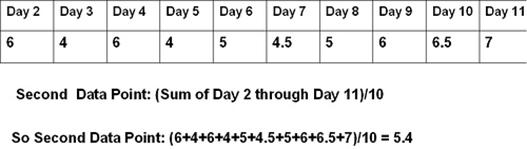
On the next day of trading, the data point which occupied the first day used in the above moving average is dropped from the equation. The data point which was day-2 in the equation becomes day-1. The next day of trading becomes the 10th data point in the equation.
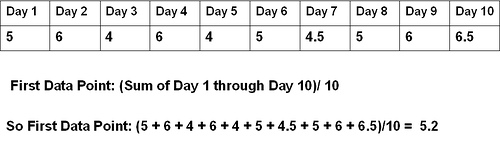
Data Point 2
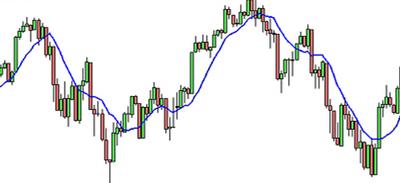
Simple Moving Average displayed on a Chart
Apply for Technical Analysis Certification Now!!
http://www.vskills.in/certification/Certified-Technical-Analyst
